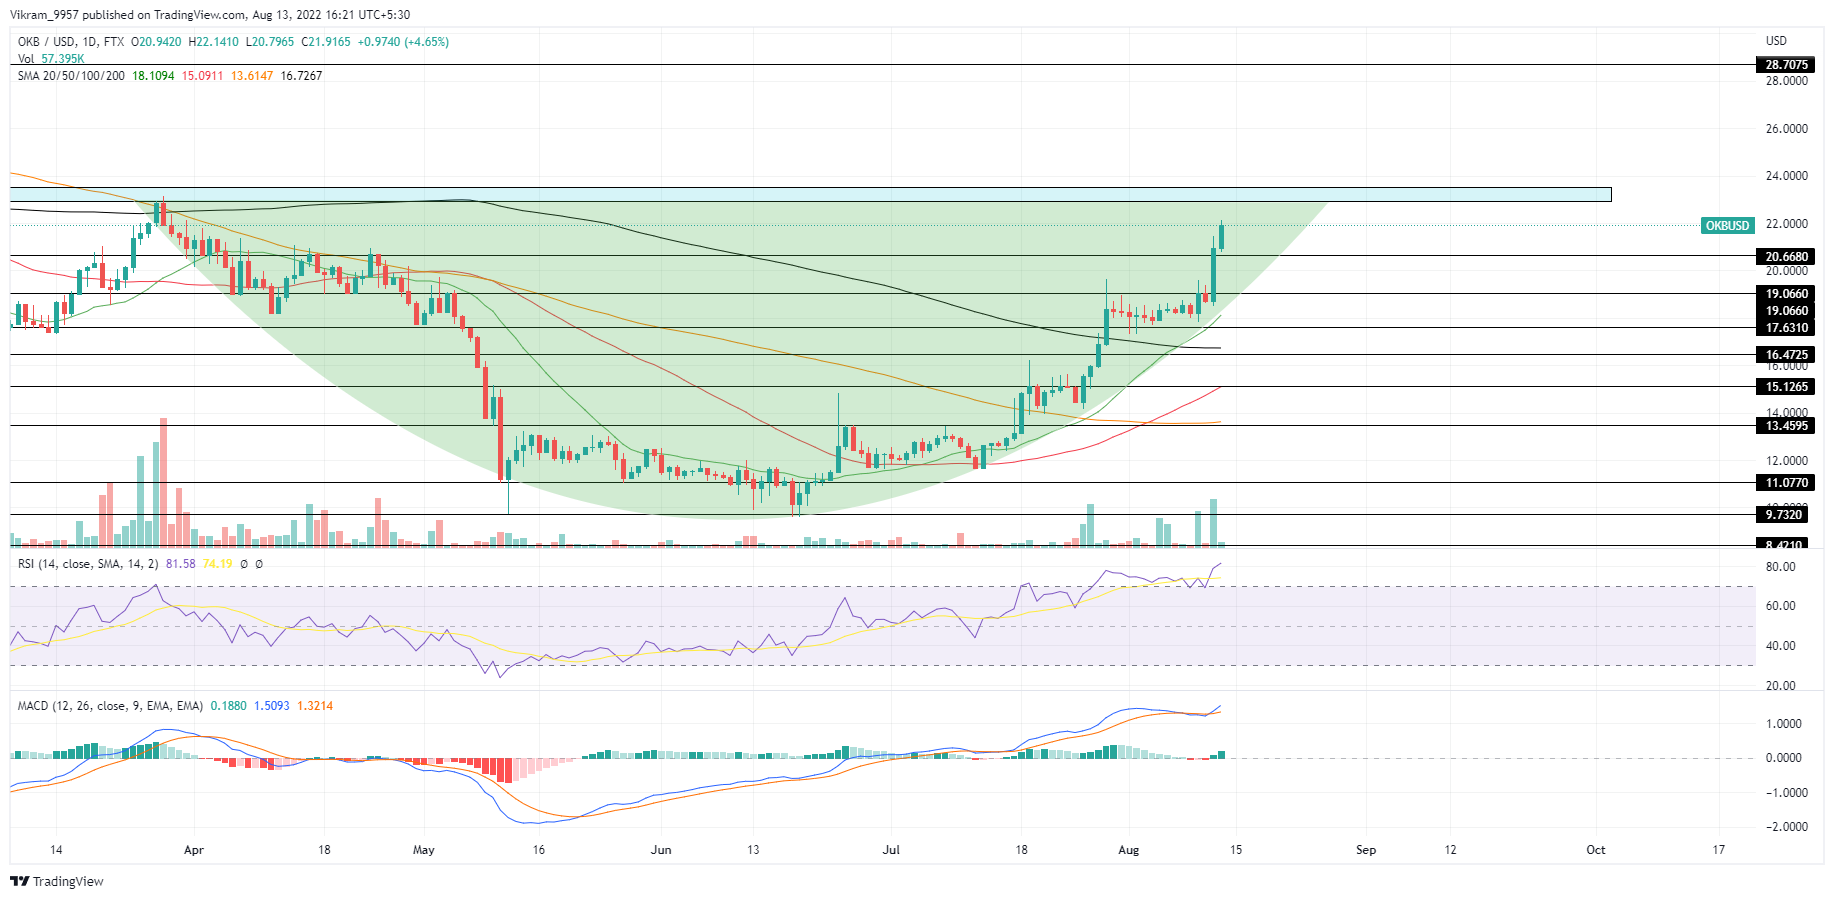
The OKB price action shows a rounding bottom pattern forming in the daily chart teasing a breakout rally exceeding the $30 mark.
Key Technical Points:
- The market price has increased by almost 126% in the last two months.
- The 50 and 200-day SMA are on the verge of a bullish crossover.
- With a market cap of $1.31 billion, the intraday trading volume of OKB has increased by 14% to reach $27.49 million.
Past Performance of OKB
The OKB price action shows a bullish turnaround in the correction phase from the crucial support level of $10. The bullish reversal exceeds the essential SMAs in the daily chart and the psychological mark of $20, accounting for a price jump of 126% over the past two months. Furthermore, the price action inchoates a rounding bottom pattern with a neckline at the $23 supply zone.  Source - Tradingview
OKB Technical Analysis
The 18% price jump over the last 48 hours in OKB prices reflects an increase in buying pressure evident by the spike in trading volume. Hence traders can expect the bullish trend to complete the rounding bottom pattern over the weekend If the buying pressure sustains. The declining bearish gap between the 50 and 200-day SMA projects a high possibility of a golden crossover. The daily RSI slope sustains in the overbought territory after the recent reversal from the 70% boundary to rise above the 14-day average line. Furthermore, the MACD and signal lines regain the bullish alignment with a new trend of bullish histograms. In a nutshell, the OKB technical analysis projects a high likelihood of a prolonged uptrend reaching the $23 supply zone.
Upcoming Trend
If the OKB price trend gains bullish momentum, traders can expect a breakout rally reaching the $30 mark. However, a bearish reversal from the $23 supply zone will test the crucial support of $20. Resistance Levels: $23 and $28 Support Levels: $20 and $17
 cryptoknowmics.com