The Solana price analysis reveals that the bullish rally seems to be getting stronger as the cryptocurrency achieved another target in the past 24 hours. The bulls have been covering a high range for the past week, as the buying activity reached its peak today as the coin has marked a higher high at $47.6. Yesterday, the cryptocurrency crossed $44.82 resistance, and it seems that the price will cross above $49.7 resistance if the current trend continues and market sentiment remains positive.
SOL/USD 1-day price chart: Bullish momentum intensifies as price breaks above the highest volatility marker
The daily Solana price analysis confirms a strong bullish trend for the market today as the price covered an upward movement in the past 24 hours. The buyers have been controlling the price trends for the past week as a significant rise in the SOL/USD value has been observed. The bullish price curve just reached the $47.6 peak during the day because of the stronger pressure from the buyers’ end. The Moving Average (MA) stands at $46.5, quite lower than the current price.
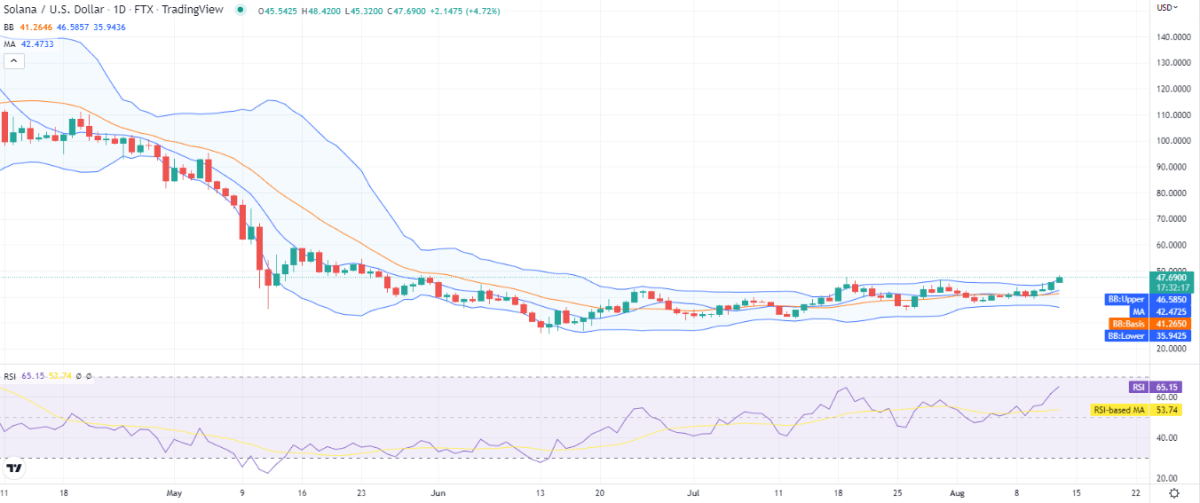
A crossover between the SMA 20 curve and the SMA 50 curve was recorded a few days back as well as the bulls secured successive wins. Moving on towards the Bollinger Bands Indicator, the upper band touches the $46.5 end, whereas the lower band touches the $35.9 extreme, indicating the strongest support for the cryptocurrency, whereas the price has shooted past the upper limit of the volatility indicator. Lastly, the Relative Strength Index (RSI) graph shows an ascending curve, and the score has reached the 65 indexes traveling towards the overbought area.
Solana price analysis: Recent developments and further technical indications
The four-hour Solana price analysis leads the buyers as the price continues to surge for the past few hours. Overall, the bulls remained dominant during the day, completely sidelining the bears. The coin value has rallied to its former height, i.e., $47.6, as the bulls have been defining the price path for the past 20 hours. Yet, the moving average stands at $44.4 above the SMA 50 curve.
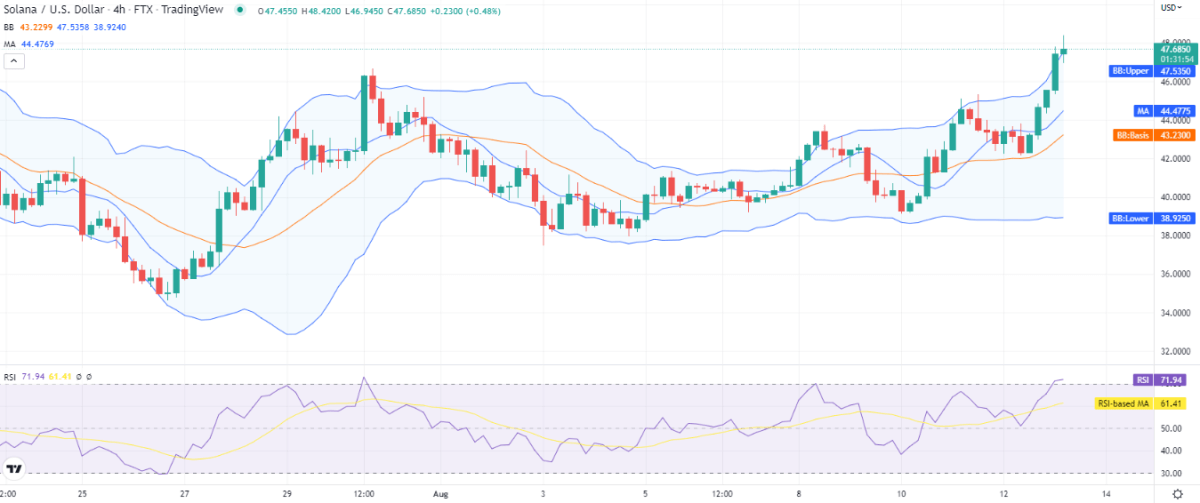
The Bollinger bands are seemingly expanding as the volatility is increasing, which should be taken as a positive hint regarding future trends. The upper Bollinger band displays a $47.5 figure which is below the current price level, whereas the lower Bollinger band is present at a $38.9 level. The RSI has entered the overbought region, and the score has touched the 71 markers.
Solana price analysis conclusion
Daily and hourly Solana price analysis shows a solid bullish inclination for the day, as recorded a rise in SOL/USD market value. The price successfully reached $47.6 high, and a further improvement in coin value seems possible. We expect SOL/USD to continue upside for today as the bullish momentum intensifies with each passing hour.
Disclaimer. The information provided is not trading advice. Cryptopolitan.com holds no liability for any investments made based on the information provided on this page. We strongly recommend independent research and/or consultation with a qualified professional before making any investment decisions.