The Polkadot price analysis indicates that the bullish momentum has brought the price to the $9.54 level and more improvement in the coin’s value is to be expected in the coming hours. Polkadot’s price trend line has been upwards for the past few weeks as the coin has shown good performance over the past week, gaining significant value. Currently, DOT/USD is testing the $9.87 resistance level today, which seems plenty strong; if the bullish momentum continues, then DOT may break above this resistance level as well.
DOT/USD 1-day price chart: DOT gains 3.33 percent value more
The 1-day Polkadot price analysis shows that an increase in the price value has been observed today as the DOT/USD pair is trading for $9.54 at the time of writing. The crypto pair has gained a value of 3.33 percent over the last 24 hours and shows around a 10.05 percent gain in value over the course of the last seven days, which is a major improvement in the coin’s value made possible by a continuation of the bullish trend. However, the trading volume has decreased by 12.66 percent, which is a small deficit but still shows a lack of momentum.
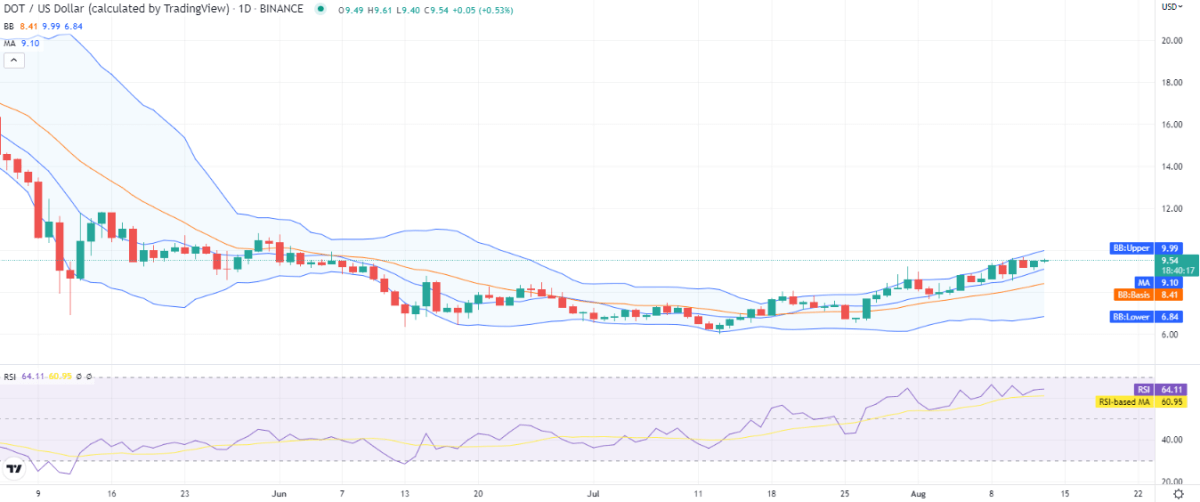
The volatility for DOT/USD is increasing as the Bollinger bands are expanding, and it seems that the bands will expand further in the near future, which will indicate more volatility for DOT price, moreover, as the price is trading near the upper limit of the indicator present at the $9.99 representing resistance for the coin, and the lower band at the $6.84 represents the strongest support for the cryptocurrency.
The moving average (MA) is present at the $9.10 mark above the SMA 50 curve and below the current price level. Moreover
the relative strength index (RSI) is on an upwards curve at index 64, indicating the buying activity going on in the market.
Polkadot price analysis: Recent developments and further technical indications
The 4-hour Polkadot price analysis shows that the price breakout was upwards at the start of the trading session, and the price increased to $9.58, but selling pressure appeared, and the price decreased slightly during the last four hours. However, the price function is headed down once again as the price is again covering the range downwards at the time.
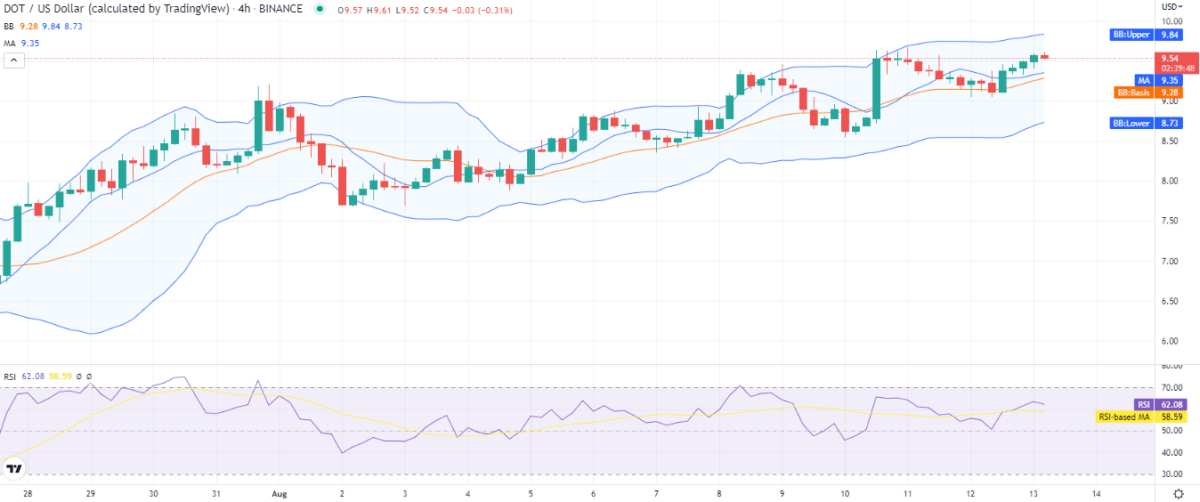
The volatility on the 4-hour chart is mild as the volatility indicator’s lower limit has traveled up. Now the upper Bollinger band is at $9.84, and the lower band is at the $8.73 mark. The moving average is trading at the $9.35 mark, and the RSI shows a slight downwards curve as it trades at index 62 due to the selling pressure at the moment.
Polkadot price analysis conclusion
The Polkadot price analysis shows that the coin is trying to surpass the $9.87 resistance, as the price is still trading on the greener side. But as the price function is again headed down, we expect DOT/USD to correct for a few hours before re-attempting the said resistance again. On the flip side, if the bearish momentum intensifies, then DOT may look for support near the $9.29 support zone.
Disclaimer. The information provided is not trading advice. Cryptopolitan.com holds no liability for any investments made based on the information provided on this page. We strongly recommend independent research and/or consultation with a qualified professional before making any investment decisions.