Polkadot price analysis is currently bearish as the market slides below $9.11. This comes after a period of consolidation around this price level. The bears now seem to be in control as they push DOT/USD prices towards support at $9.07. Polkadot market has been in a consolidation phase over the last few days as it trades between $8.40 and $9.52 levels. The digital asset is currently trading at $9.11 and is down by over 3.02 percent on the day. The market cap for DOT is currently at $10 billion and the 24-hour trading volume stands at $611 million.
Polkadot price analysis on a 1-day price chart: DOT loses another 3.02 percent as the price reaches down to $9.11
The daily price chart for Polkadot price analysis confirms a strong bearish trend for the market today as the price covered a downward movement in the past 24 hours. The market is currently trading very close to the key support level at $9.07 and any further movement to the downside could see the price retesting the lows of $8.50 as bulls attempt to defend this level. The current market conditions for DOT/USD seem to be bearish in the short term but a breakout from the current consolidation range could see the market make a move towards the $10 mark.
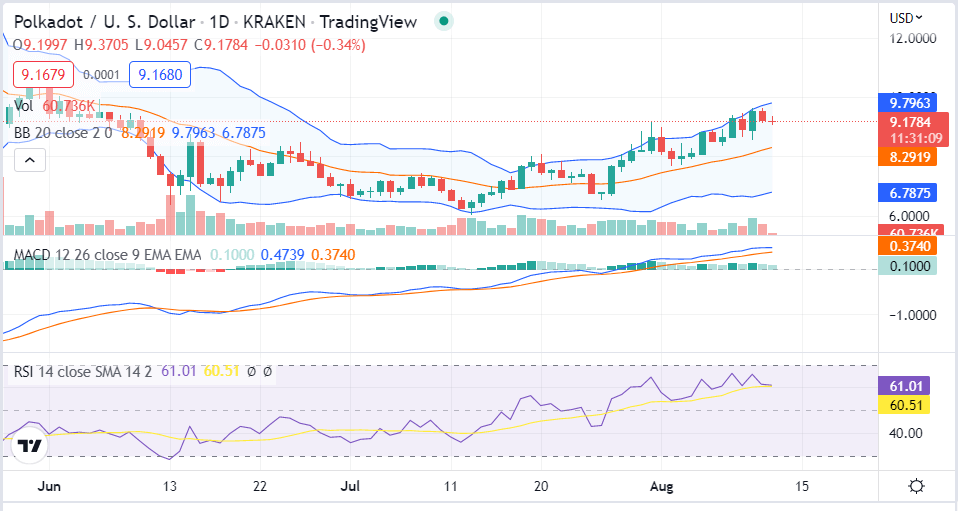
The MACD indicator is currently in the bearish zone as the signal line moves above the candlesticks. The RSI indicator for DOT/USD is currently at 47.75 and is heading towards oversold levels which could see bulls make a comeback soon. The upper Bollinger Band is currently at $8.35 and the lower Bollinger Band is at $7.97. The DOT/USD price is currently very close to the lower Bollinger Band which could see a rebound in prices soon.
On the 4-hour DOT/USD price chart: Price action is expected to remain bearish
The 4-hour price chart for Polkadot price analysis shows that the market has been in a bearish trend since the beginning of today. The market had attempted to make a move towards $10 but was unable to sustain this level and fell back below $9.11. The current market conditions for DOT/USD are bearish as the price is trading very close to key support at $9.07.
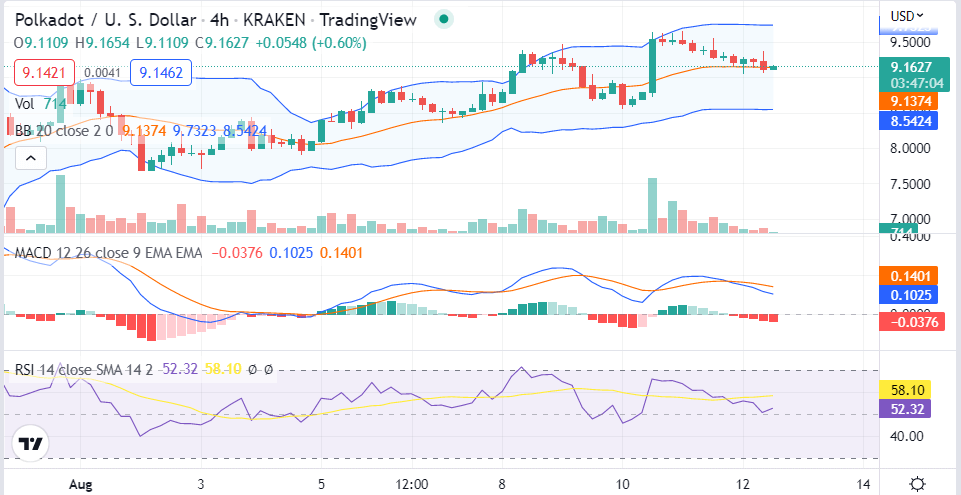
The market is expected to remain bearish in the short term as the MACD indicator is moving below the signal line which is a bearish sign. The Relative Strength Index indicator is moving towards oversold levels which could see the market make a move towards $9.52 in the near future. The Bollinger Bands for DOT/USD are currently very close to each other which indicates that the market is in a state of consolidation.
Polkadot price analysis conclusion
Polkadot price analysis confirms that the price has undergone a severe decline during the day. The DOT/USD price is now touching the $9.07 mark, which is the lowest and it can be expected that it will move down to further lows in the approaching hours. However, the price has reached the support zone, and there are chances that the price may bounce back from here if buyers’ support comes into play.
Disclaimer. The information provided is not trading advice. Cryptopolitan.com holds no liability for any investments made based on the information provided on this page. We strongly recommend independent research and/or consultation with a qualified professional before making any investment decisions.