
$GRT price trend remains trapped within a rising wedge pattern, but the recent bull cycle teases an upside breakout to reach $0.20.
Key Technical Points:
- The Graph ($GRT) price jumped 16% last day from the $0.12 support level, teasing a bullish breakout.
- The bull cycle challenges the resistance trendline after the 100-day SMA breakout.
- With a market cap of $1.032 billion, the intraday trading volume of The Graph has increased by 380% to reach $221 million.
Past Performance of $GRT
As we mentioned in our previous article, the $GRT price action maintains a rising trend after the bullish reversal from the $0.086 mark, accounting for a 72% jump over the last month. The bull run exceeds the 50 and 100-day SMAs and reaches the psychological mark of $0.15. Moreover, the price trend inchoates a rising wedge pattern in the daily chart, and the recent bull cycle challenges the resistance trendline. 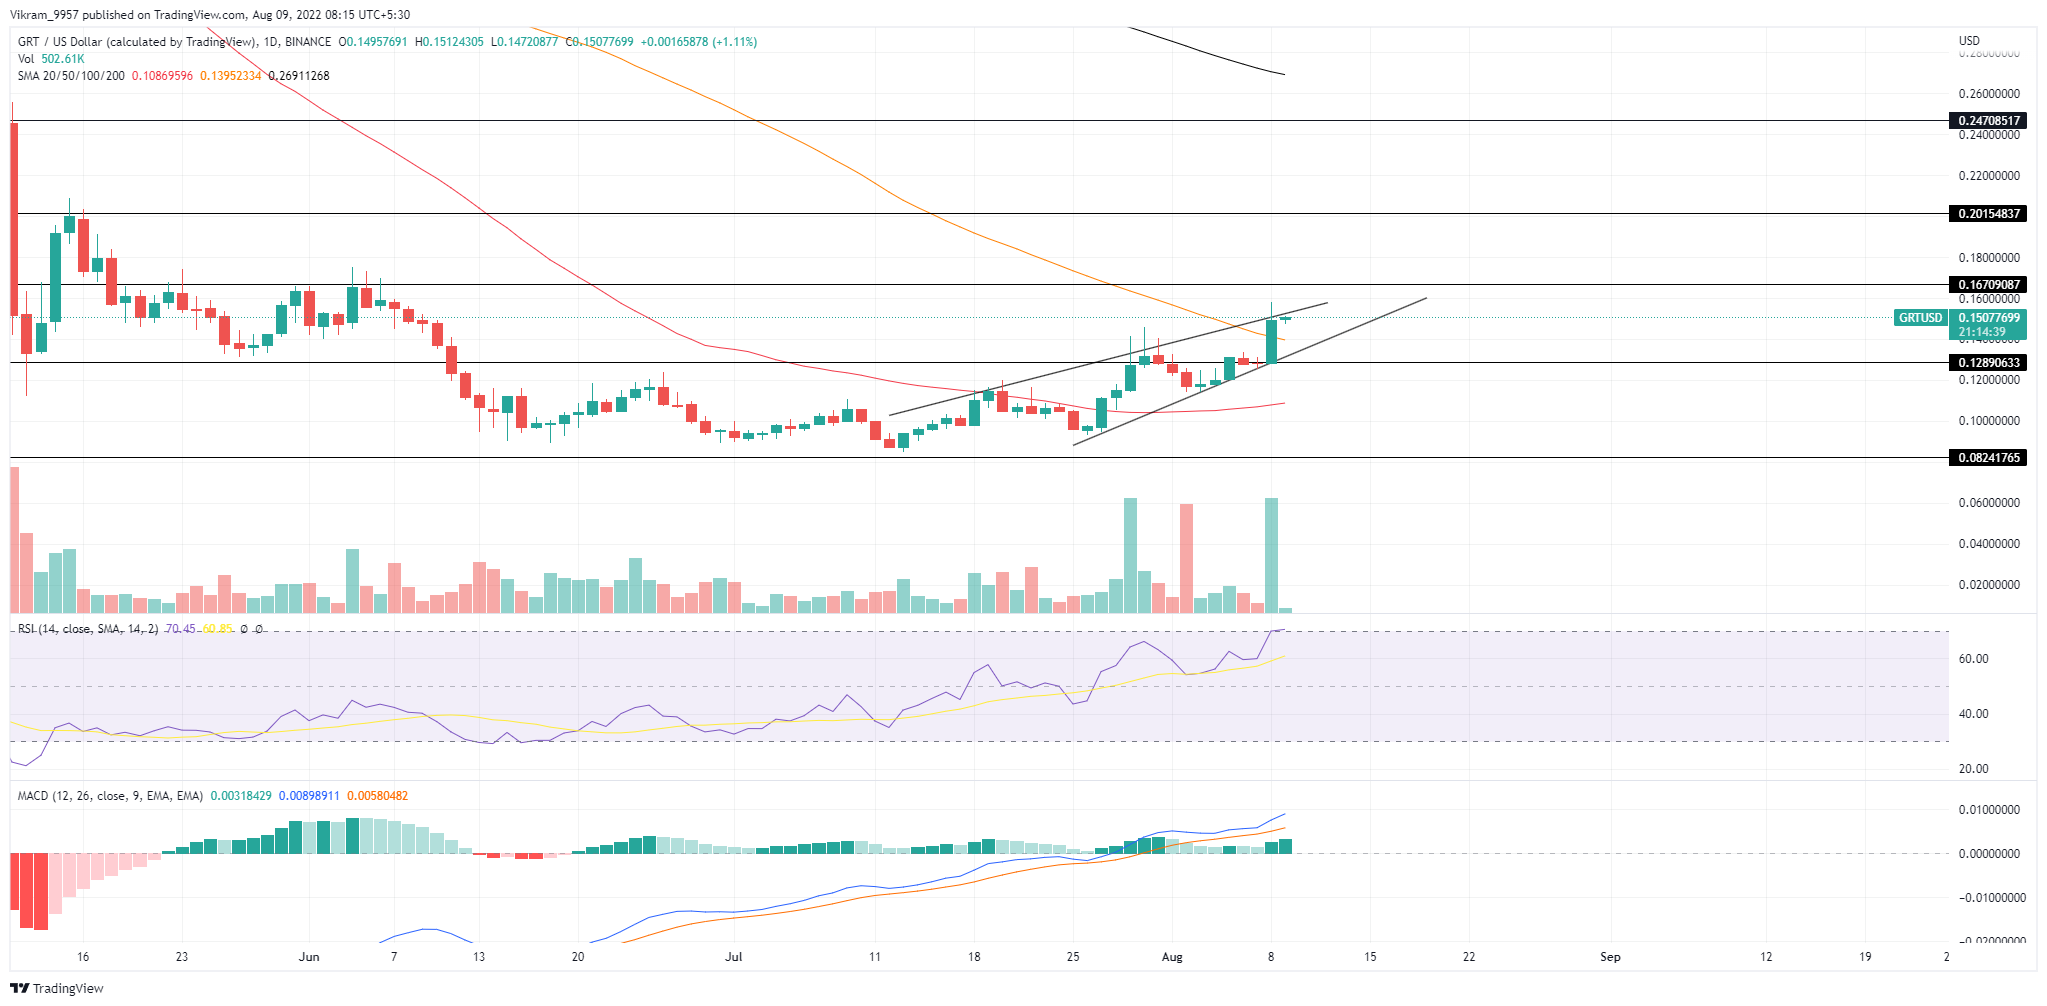 Source - Tradingview
$GRT Technical Analysis
Currently, the $GRT price action displays a bullish engulfing candle with a 16% jump, but the wick formation shows an increased supply at the resistance trendline. Hence, traders should wait for a price action confirmation to avoid getting trapped in a bearish downfall. As The Graph market price beats the 100-day SMA, the increased bullish influence results in a lateral shift in the 50-day SMA. Moreover, a spike in intraday trading volume supports the bullish candle and increases the possibility of an upside breakout. The daily-RSI slope approaches the overbought boundary while maintaining a gradual uptrend with the 14-day SMA support. Hence, the indicator reflects an improvement in the underlying bullish sentiments. The MACD indicator shows a long-coming uptrend in the fast and slow lines avoiding multiple bearish crossovers to rise above the zero line. Moreover, the recent gain in bullish spread with the spike in MACD histograms reflects an increase in buying pressure. In a nutshell, the $GRT technical analysis projects a high likelihood of an uptrend continuation.
Upcoming Trend
If the $GRT price trend breaks above the rising wedge, the unleashed bullish momentum can drive the prices higher to the $0.20 mark. However, a bearish reversal will retrace to the support trendline and retest the crucial 100-day SMA. Resistance Levels: $0.18 and $0.20 Support Levels: $0.13 and $0.11