DOGE price action forms an ascending triangle pattern with the overhead resistance at $0.72. Will buyers crack the bearish withhold? Key technical points:
- The Dogecoin(DOGE) price sustains above the 50-day SMA and challenges the supply zone at $0.072.
- The bullish breakout rally of the ascending triangle will reach the next bearish milestone at $0.093.
- With a market cap of $9.28 Billion, the intraday trading volume of Dogecoin has decreased by 6% to reach $207 Million.
Past Performance of DOGE
As mentioned in our previous article, DOGE prices approach the overhead resistance of a supply zone at $0.070. However, the daily candle closed below the supply zone with a long wick formation due to increased selling pressure. Hence, the market prices re-traced back to the support trendline, resulting in an ascending triangle pattern. Currently, the price action displays a bullish reversal from the confluence of the support trendline and 50-day SMA, challenging the overhead resistance. 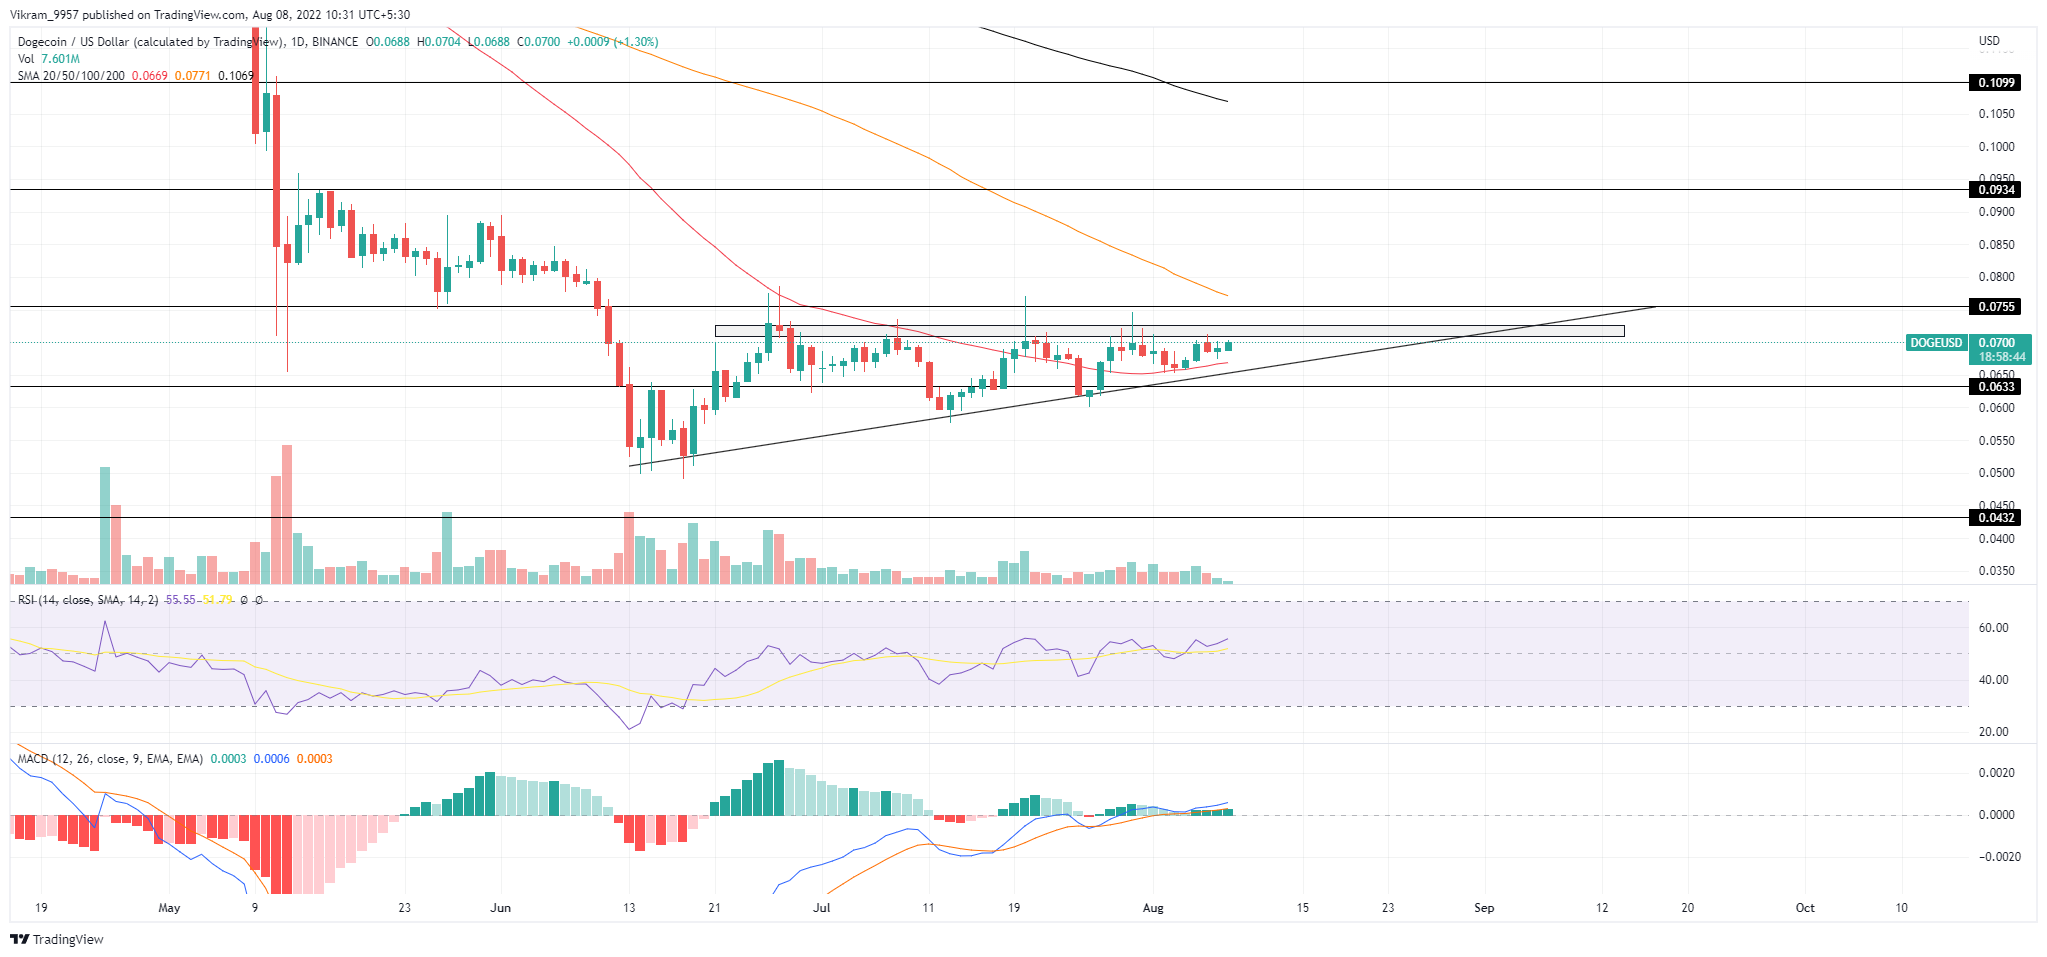 Source- Tradingview
DOGE Technical Analysis
Currently, the DOGE prices attempt to form a morning star pattern above the 50-day SMA in hopes of gaining bullish momentum. However, the bullish breakout rally will also have to undermine the higher price rejection candles formed due to the supply pressure at $0.075. Hence traders will have to stay cautious in avoiding entry into a bullish trade due to FOMO. The positive turnaround in the 50-day SMA supports the bullish attempt of the ascending triangle breakout. Furthermore, the traders can expect the breakout rally to exceed the 100-day SMA and additionally fuel the uptrend. The RSI slope maintains a gradual uptrend about the halfway line displaying no signal of a bearish divergence. Moreover, the MACD indicator shows the fast and slow lines maintaining a positive alignment above the zero line with an increase in the bullish histograms. Hence the technical indicators maintain a bullish bias and increase the possibility of an upside breakout. In a nutshell, the DOGE technical analysis suggests the traders should wait for the daily candle to close above the supply zone and undermine the sellers and $0.075.
Upcoming Trend
If the breakout rally gains momentum, the DOGE prices will skyrocket above the $0.075 mark. Hence traders can expect the market value to shoot above to reach the $0.095 mark. However, a bearish reversal Breaking below the support train line will retest the crucial support at the $0.063 mark. Resistance Levels: $0.075 and $0.095 Support Levels: $0.063 and $0.050