- Ethereum completes a daily 10% price increase, and a 7-day 15% gains, recording a current high of $245.
- ETH hit resistance at a bearish .786 Fib Retracement before dropping by 2.5% today down to the $235 price region.
- Against Bitcoin, Ethereum exploded to 0.025 BTC, which is a new 30-day high.
Key Support & Resistance Levels
ETH/USD:
Support: $230, $225, $220.
Resistance:$245, $250, $260.
ETH/BTC:
Support: 0.0245 BTC, 0.024 BTC, 0.0236 BTC.
Resistance: 0.0255 BTC, 0.0259 BTC, 0.0263 BTC.
ETH/USD – Ethereum Bulls Back On The Offensive
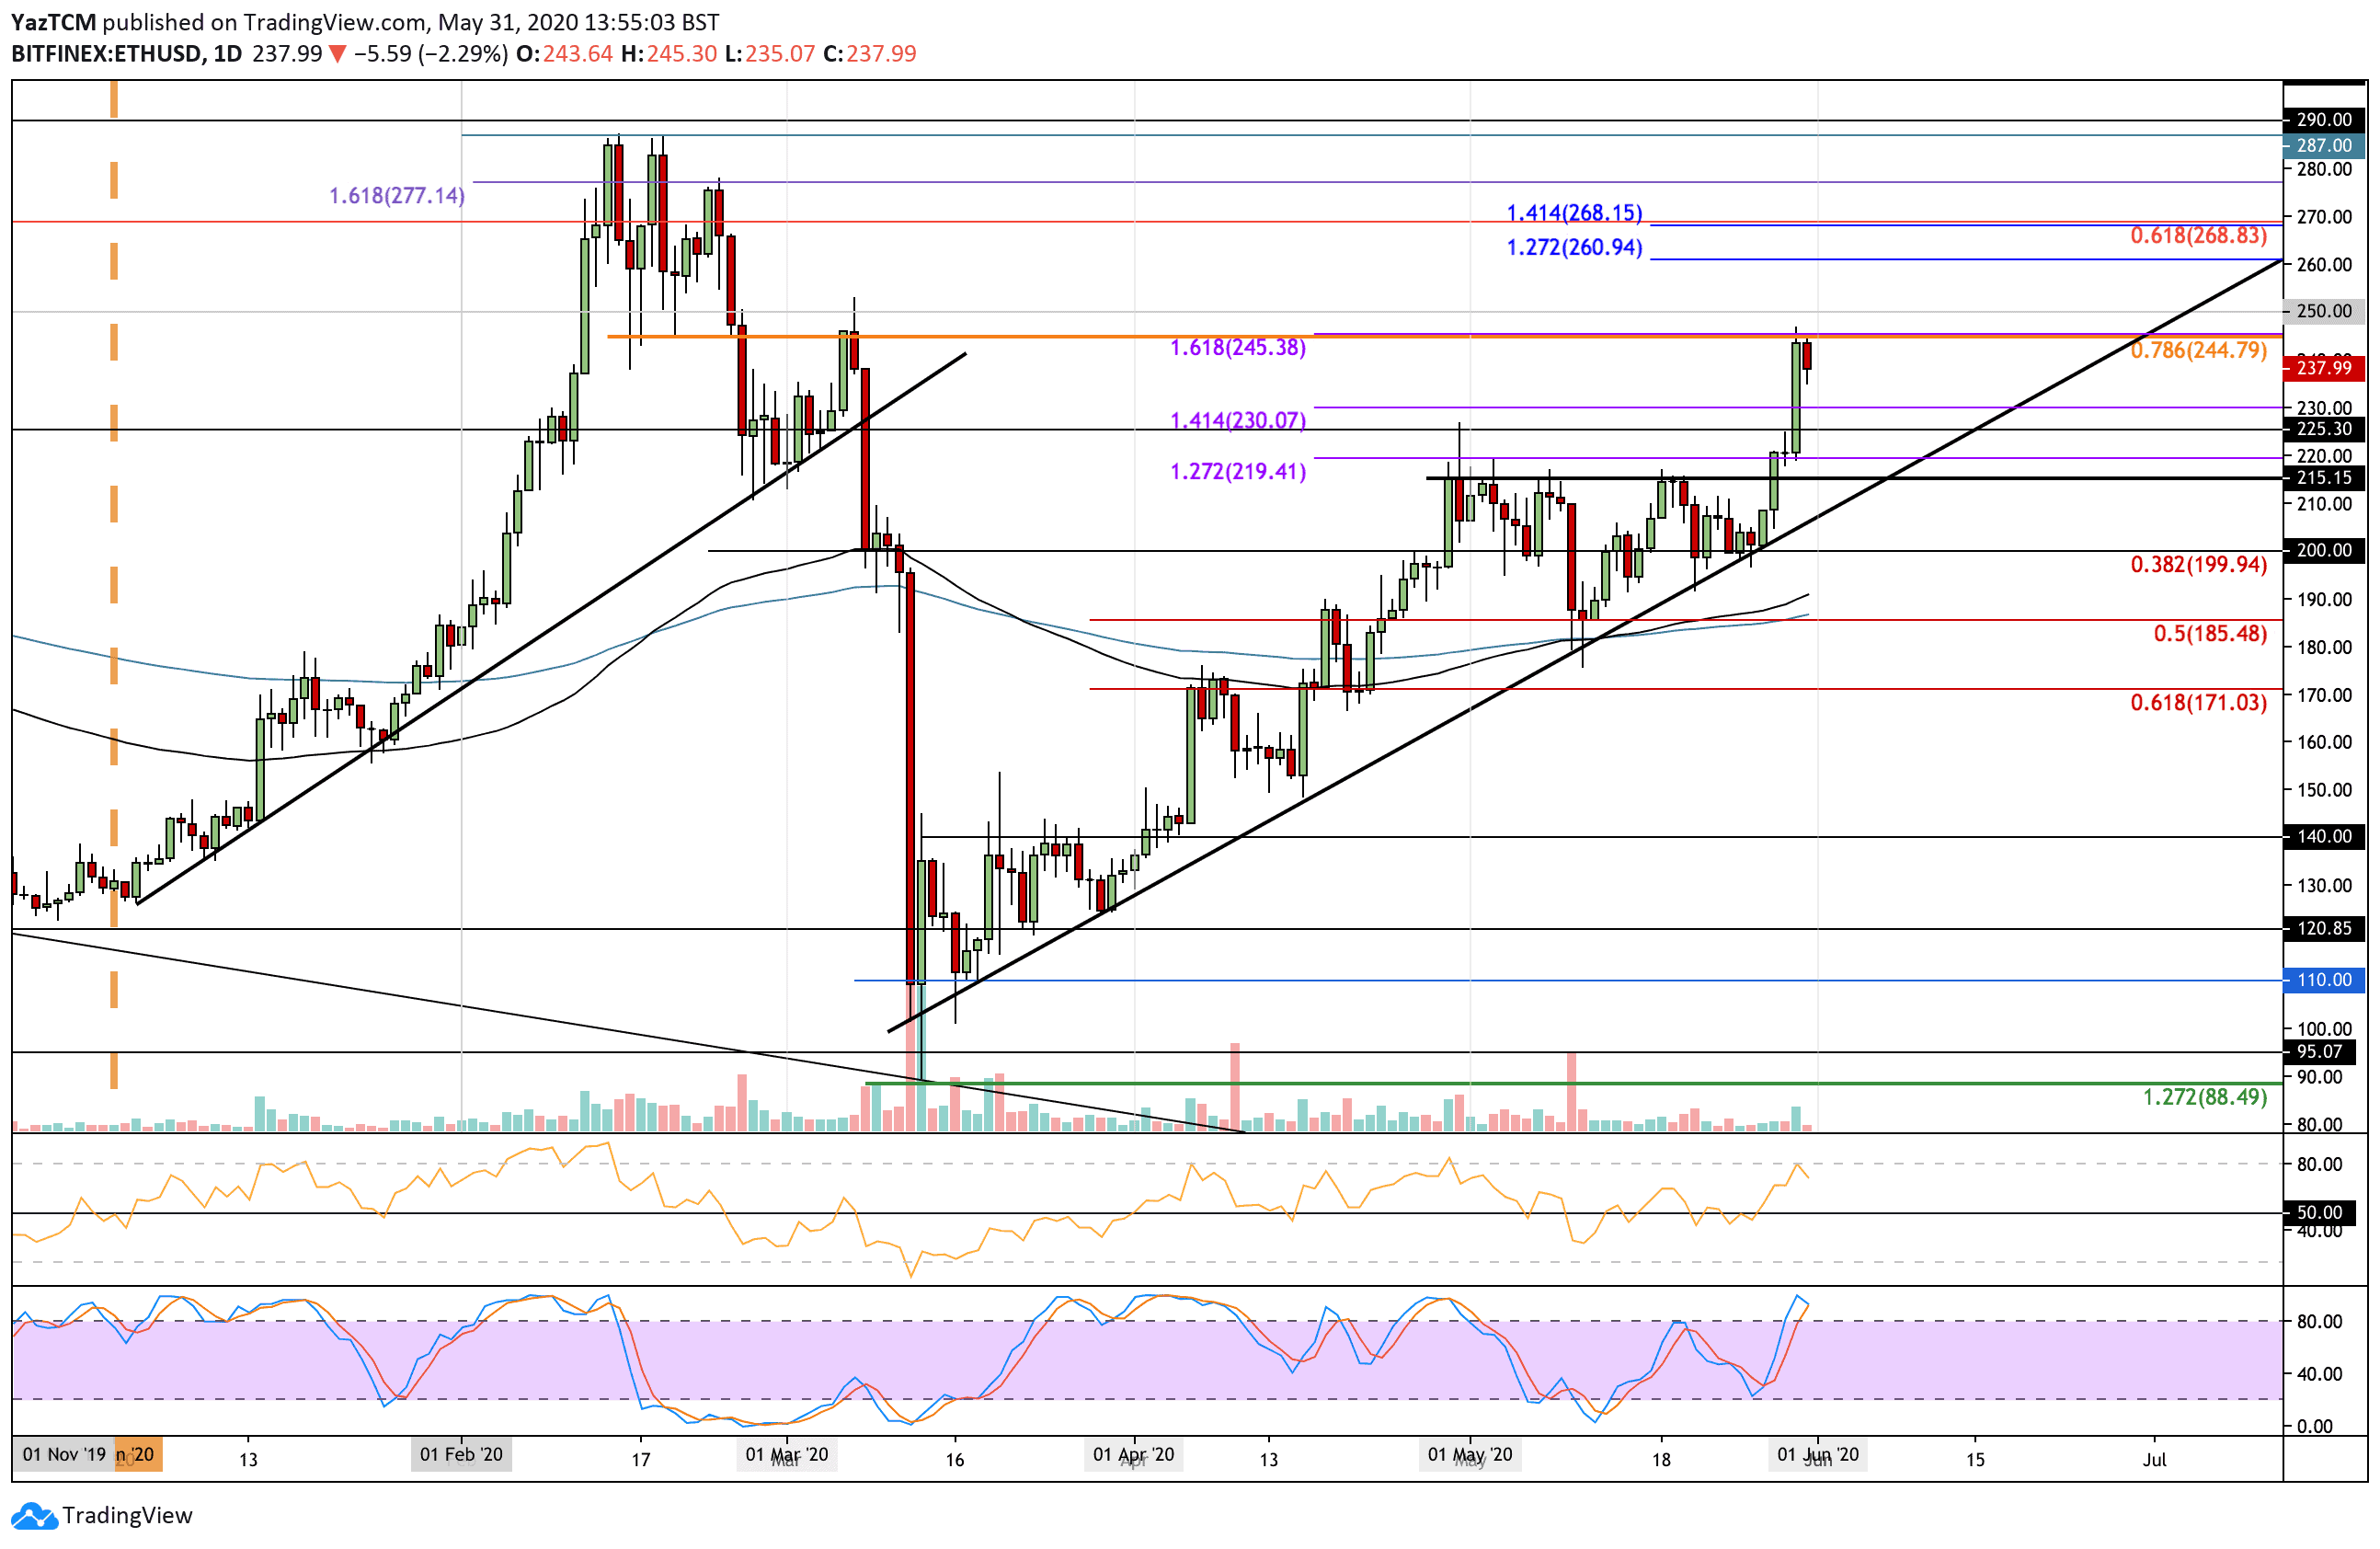
Ethereum managed to break the upper boundary of the marked ascending triangle from last Thursday (28th of May) at $215. This allowed ETH to break out of the previous consolidation pattern as the bulls went back on the offensive as they set their sights to $250.
Yesterday, Ethereum surged as much as 11% on the daily, setting a monthly high at the $245 level, where lies resistance provided by a bearish .786 Fibonacci Retracement level. A 1.618 Fibonacci Extension level further bolsters this area of resistance. ETH has dropped by 2.7% today as it falls into the $237 level.
ETH-USD Short Term Price Prediction
Looking ahead, if the buyers continue to push higher and break the $245 level, further resistance lies at $250 and $260 (1.272 Fib Extension). Above this, resistance lies at $268 (long term bearish .618 Fib Retracement & 1.414 Fib Extension), $277, and $287 (2020 high).
On the other hand, if the sellers push the market lower, support is lies at $230. Beneath this, further support is expected at $225, $220, and $215.
The RSI hit overbought conditions yesterday and started to point downward. As long as it does not break beneath 50, the buyers will remain in control of the market, and ETH might approach the 2020 highs.
Additionally, the Stochastic RSI is primed for a bearish crossover signal that could send the market lower for a correction before rebounding higher.
ETH/BTC – ETH Surges Higher To Reach Falling Trend Line Resistance
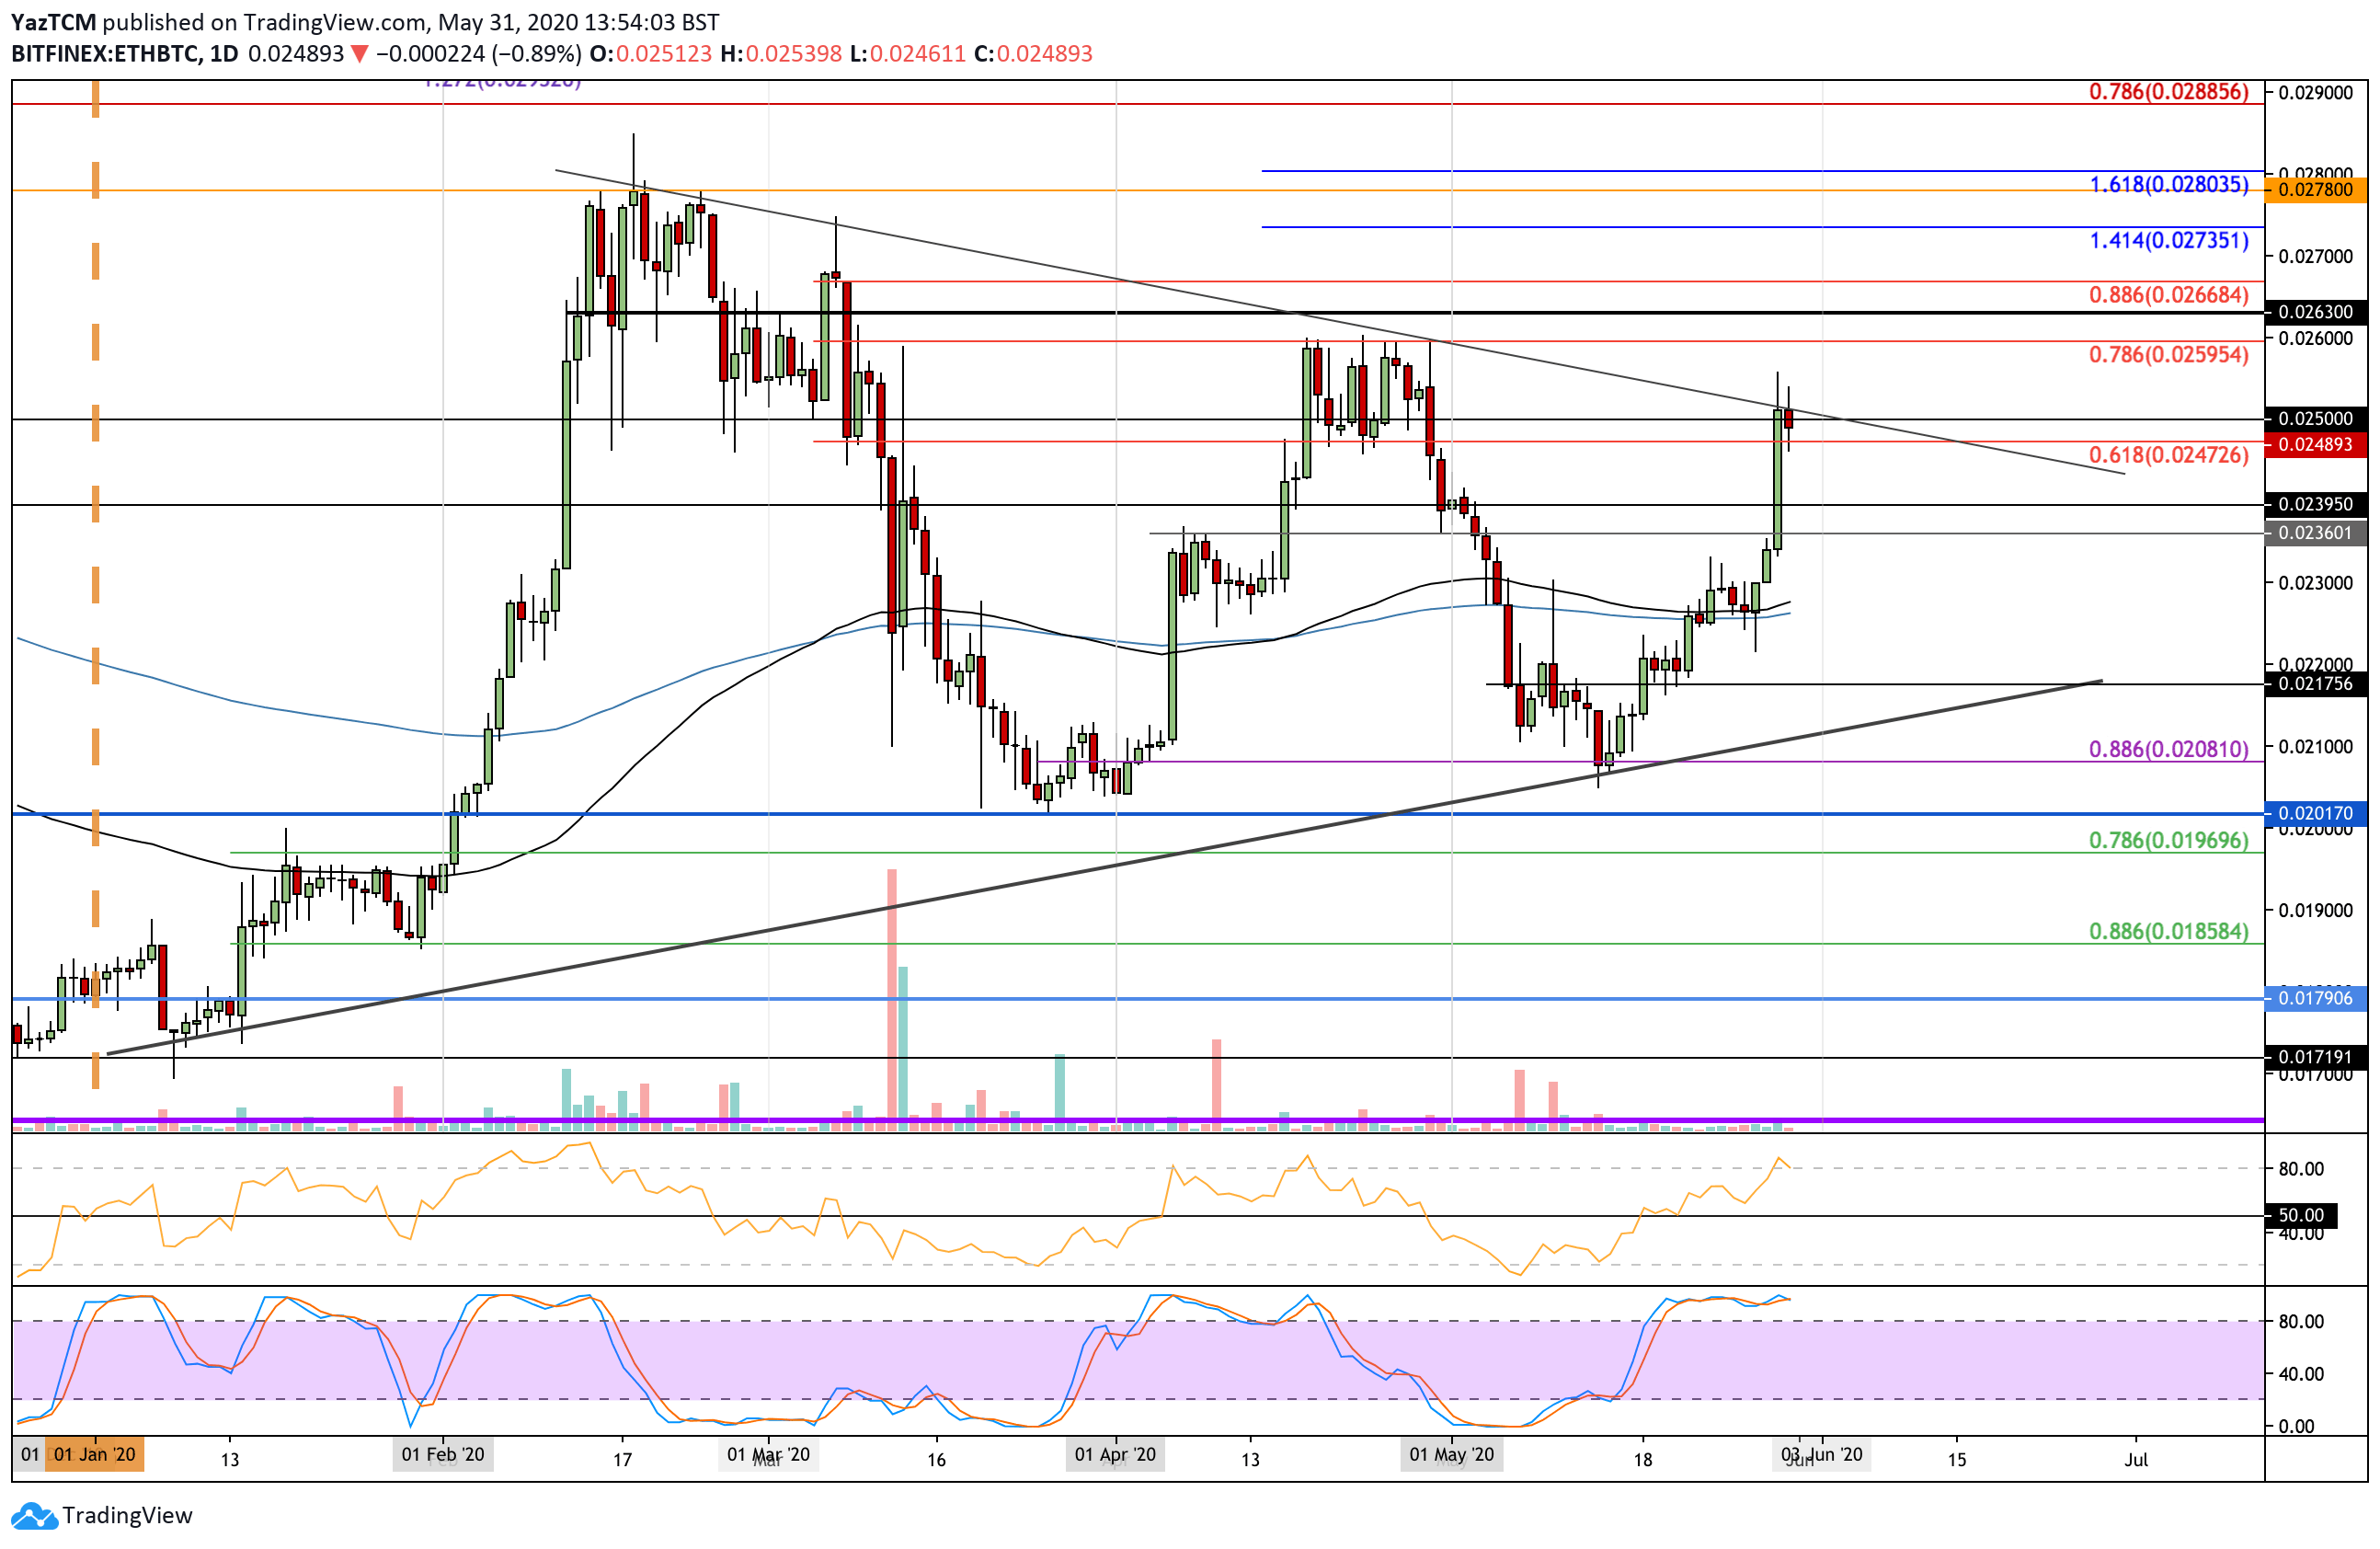
Against Bitcoin, Ethereum also surged higher yesterday as it climbed from 0.023 BTC to reach as high as 0.025 BTC. The cryptocurrency met resistance at a descending trend line that that has been in play since February 2020.
This trend line is forming a vast symmetrical triangle and, therefore, we might see ETH falling over the next few days if it struggles to break this falling trend line. ETH has dropped slightly from 0.025 BTC today as it trades around 0.0248 BTC as of writing this update.
ETH-BTC Short Term Price Prediction
If the sellers push lower, the first level of support is expected at 0.0245 BTC. Beneath this, support lies at 0.024 BTC, 0.0236 BTC, and 0.023 BTC.
Alternatively, if the buyers push higher and break the falling trend line, the first level of resistance lies at 0.0255 BTC. Above this, resistance lies at 0.0259 BTC (bearish .786 Fib Retracement & April Highs), 0.0263 BTC, and 0.0266 BTC (bearish .886 Fib Retracement).
The RSI is also under overbought conditions here, just like ETH/USD, and might signal on a temp correction soon.