
Ethereum is stuck below the same $2,400 resistance that has blocked its recent recovery, while charts from TedPillows and Sky show a tighter setup forming near that level. A clean breakout could open the way toward $3,000 and higher, but another rejection may send $ETH back toward lower support zones.
Ethereum Price Stalls Below $2,400 as Downside Risk Builds
Ethereum traded near $2,369 on the 2 day $ETH/USDT chart shared by TedPillows. The chart shows $ETH failing again near the $2,400 resistance zone, even as Bitcoin has shown stronger price action.
TedPillows said Ethereum remains weak until it breaks above $2,400. The chart supports that view because $ETH has tested the same red resistance area several times without a confirmed breakout.
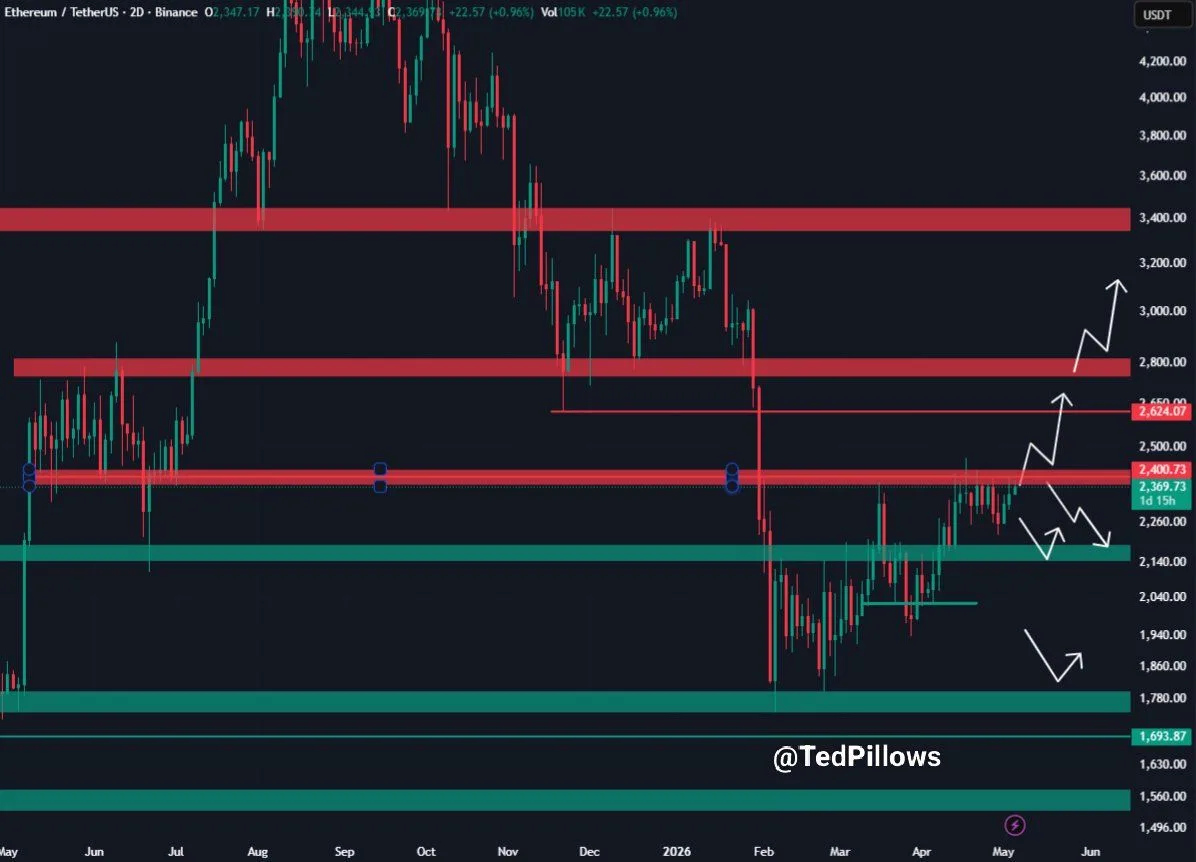
Ethereum $2,400 Resistance Chart. Source: TedPillows on X
The nearest resistance sits around $2,400 to $2,470. A stronger breakout would need $ETH to clear this zone and hold above it. After that, the next marked level appears near $2,624, followed by the larger resistance band around $2,800.
However, the chart also shows downside risk if Ethereum fails again. The nearest support sits around $2,140 to $2,180, marked by the green zone. If $ETH drops below that area, the next major support appears near $1,780, with a lower level marked around $1,693.
The white arrows on the chart show several possible paths. One path shows $ETH breaking above $2,400 and moving toward $2,624, then possibly $2,800. Another path shows $ETH rejecting from the current zone and retesting support near $2,140.
For now, Ethereum has not confirmed strength. The price remains trapped between support near $2,140 and resistance near $2,400. A clean break above $2,400 would improve the short-term structure. However, another rejection could increase pressure toward the lower support zone.
Ethereum Triangle Pattern Puts $2,400 Breakout in Focus
Ethereum traded near $2,378 on the weekly $ETH/USD chart shared by Sky. The chart shows $ETH pressing against a horizontal resistance line near $2,400, while a rising trendline supports the price from below.
Sky said a “legendary pattern” is forming for Ethereum. The chart shows a triangle setup, where price keeps moving into a tighter space between rising support and flat resistance.
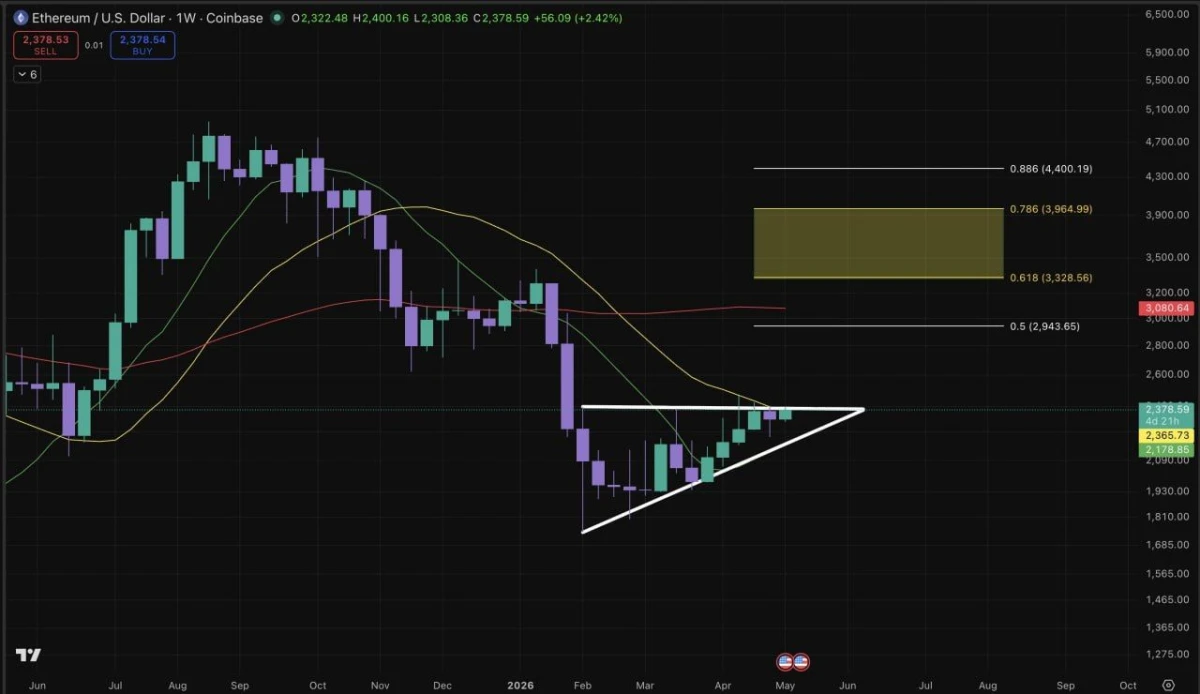
Ethereum Triangle Breakout Chart. Source: Sky on X
The key level remains $2,400. $ETH has tested this area but has not confirmed a weekly breakout yet. A clean move above that line would shift the chart structure and could open the way toward higher targets.
The chart marks the next major zone between $3,328 and $3,965, based on the Fibonacci levels shown. A separate level near $2,943 also appears on the chart, close to the $3,000 area mentioned in the post.
Sky said $ETH could move above $3,000 within weeks if it breaks through the triangle. However, the chart still needs confirmation first. Until then, the pattern remains a setup, not a completed breakout.
The moving averages also show resistance above price. The red moving average sits near $3,080, while the current price stays below it. That means $ETH may face pressure even after a short-term breakout.
For now, Ethereum remains trapped below $2,400. A weekly close above that level could support a move toward $2,943 and then the $3,328 to $3,965 zone. However, another rejection could send $ETH back toward the rising trendline support.