
Ethereum shows improving momentum, holding above key support levels, with traders eyeing potential upside.
Ethereum (ETH) has seen a 1.1% pump in the past 24 hours, trading between $3,281 and $3,386, a somewhat healthy price action. The token is currently showing positive momentum, as the price has recently surged after testing lower levels, and is now consolidating around the higher end of its 24-hour range.
Notably, over the past 7 days, Ethereum has gained 8.1%, showing sustained upward momentum. Looking at the 30-day performance, ETH is up 15.0%, signaling strong investor confidence.
The price action shows Ethereum’s v-shaped rebound, with the price testing and holding above key levels. Will Ethereum surge to break further resistance?
Can Ethereum Break Further Resistance?
The daily chart for Ethereum shows price continuing its recovery phase after a correction, with ETH now trading back above several key dynamic levels. The price has reclaimed the mid-range of the Fibonacci ribbon and is holding above the 50-day moving average near $3,289, which is now acting as short-term support.
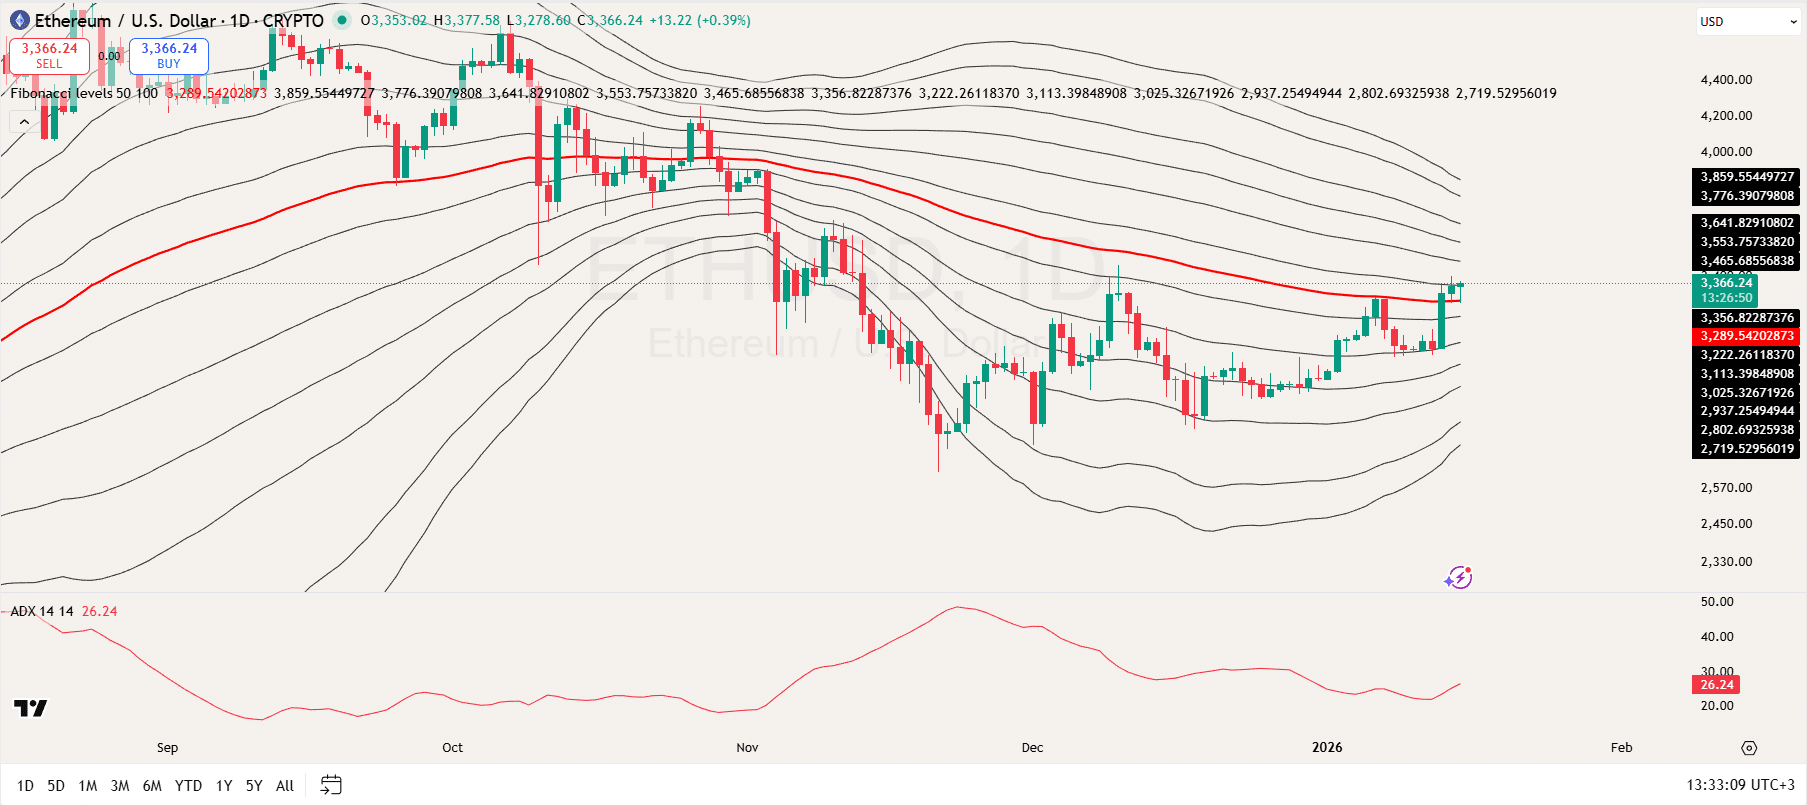
This shift suggests improving structure, as buyers are defending higher lows rather than allowing deeper pullbacks. However, ETH still faces layered resistance from the upper Fibonacci bands clustered between the $3,465–$3,859 zone, which may cap upside attempts in the near term.
From a trend strength perspective, the ADX Average Directional Index is currently reading around 26, indicating a moderately improving trend. While this is not an extreme reading, it confirms that momentum is rebuilding rather than fading.
Ethereum’s Turn Now?
An analyst on X, Ted, suggests that it is now Ethereum’s turn, pointing to a developing technical setup on the daily chart. The chart shows ETH trading within an ascending triangle structure, marked by a horizontal upper trendline which shows flat resistance and an upward-facing lower trendline with indicates higher lows.

This pattern is typically viewed as a potential bullish reversal formation, especially when the price begins to press against the upper boundary, as ETH is currently doing. Ted’s diagram implies that Ethereum may be nearing a key inflection point where momentum could shift in favor of buyers if the triangle breaks to the upside.