- Ethereum ETFs saw $5 million in net inflows as Grayscale Ethereum Trust ended its outflow streak.
- Investors are accumulating Ethereum, as evidenced by increased outflows and declining reserves across ETH exchanges.
- Key technical indicators suggest Ethereum could decline 25% to approach the $2,000 psychological level.
Ethereum is up more than 2% on Tuesday following minor inflows across ETH ETFs. ETH technical indicators suggest that its price could approach the $2,000 psychological level in the coming weeks, but investors' accumulation may prevail due to key on-chain metrics.
Daily digest market movers: ETH ETF flows, investor accumulation
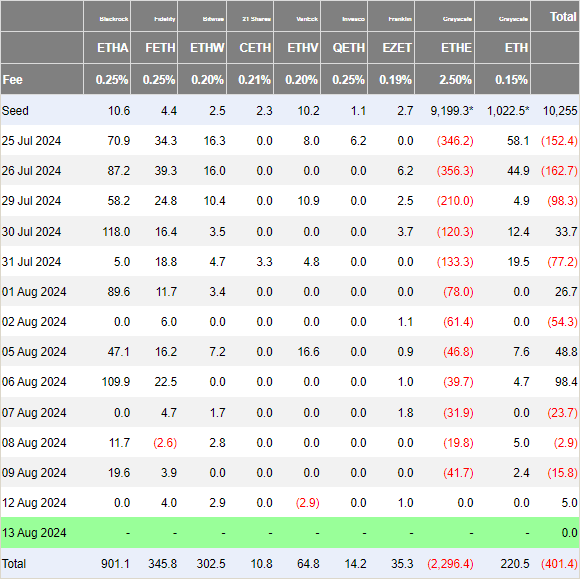
Ethereum ETFs recorded minor net inflows of $5 million on Monday, according to data from Farside Investors. The net inflows came after three consecutive days of net outflows across the nine US spot ETH ETFs.
Grayscale Ethereum Trust (ETHE) had zero flows, the first time it hasn't seen outflows since ETH ETFs launched. Fidelity's FETH led the way with $4 million in net inflows, accompanied by Bitwise's ETHW, which saw $2.9 million in inflows. Notably, VanEck's ETHV saw net outflows for the first time, recording a loss of $2.9 million.

Ethereum ETF Flows
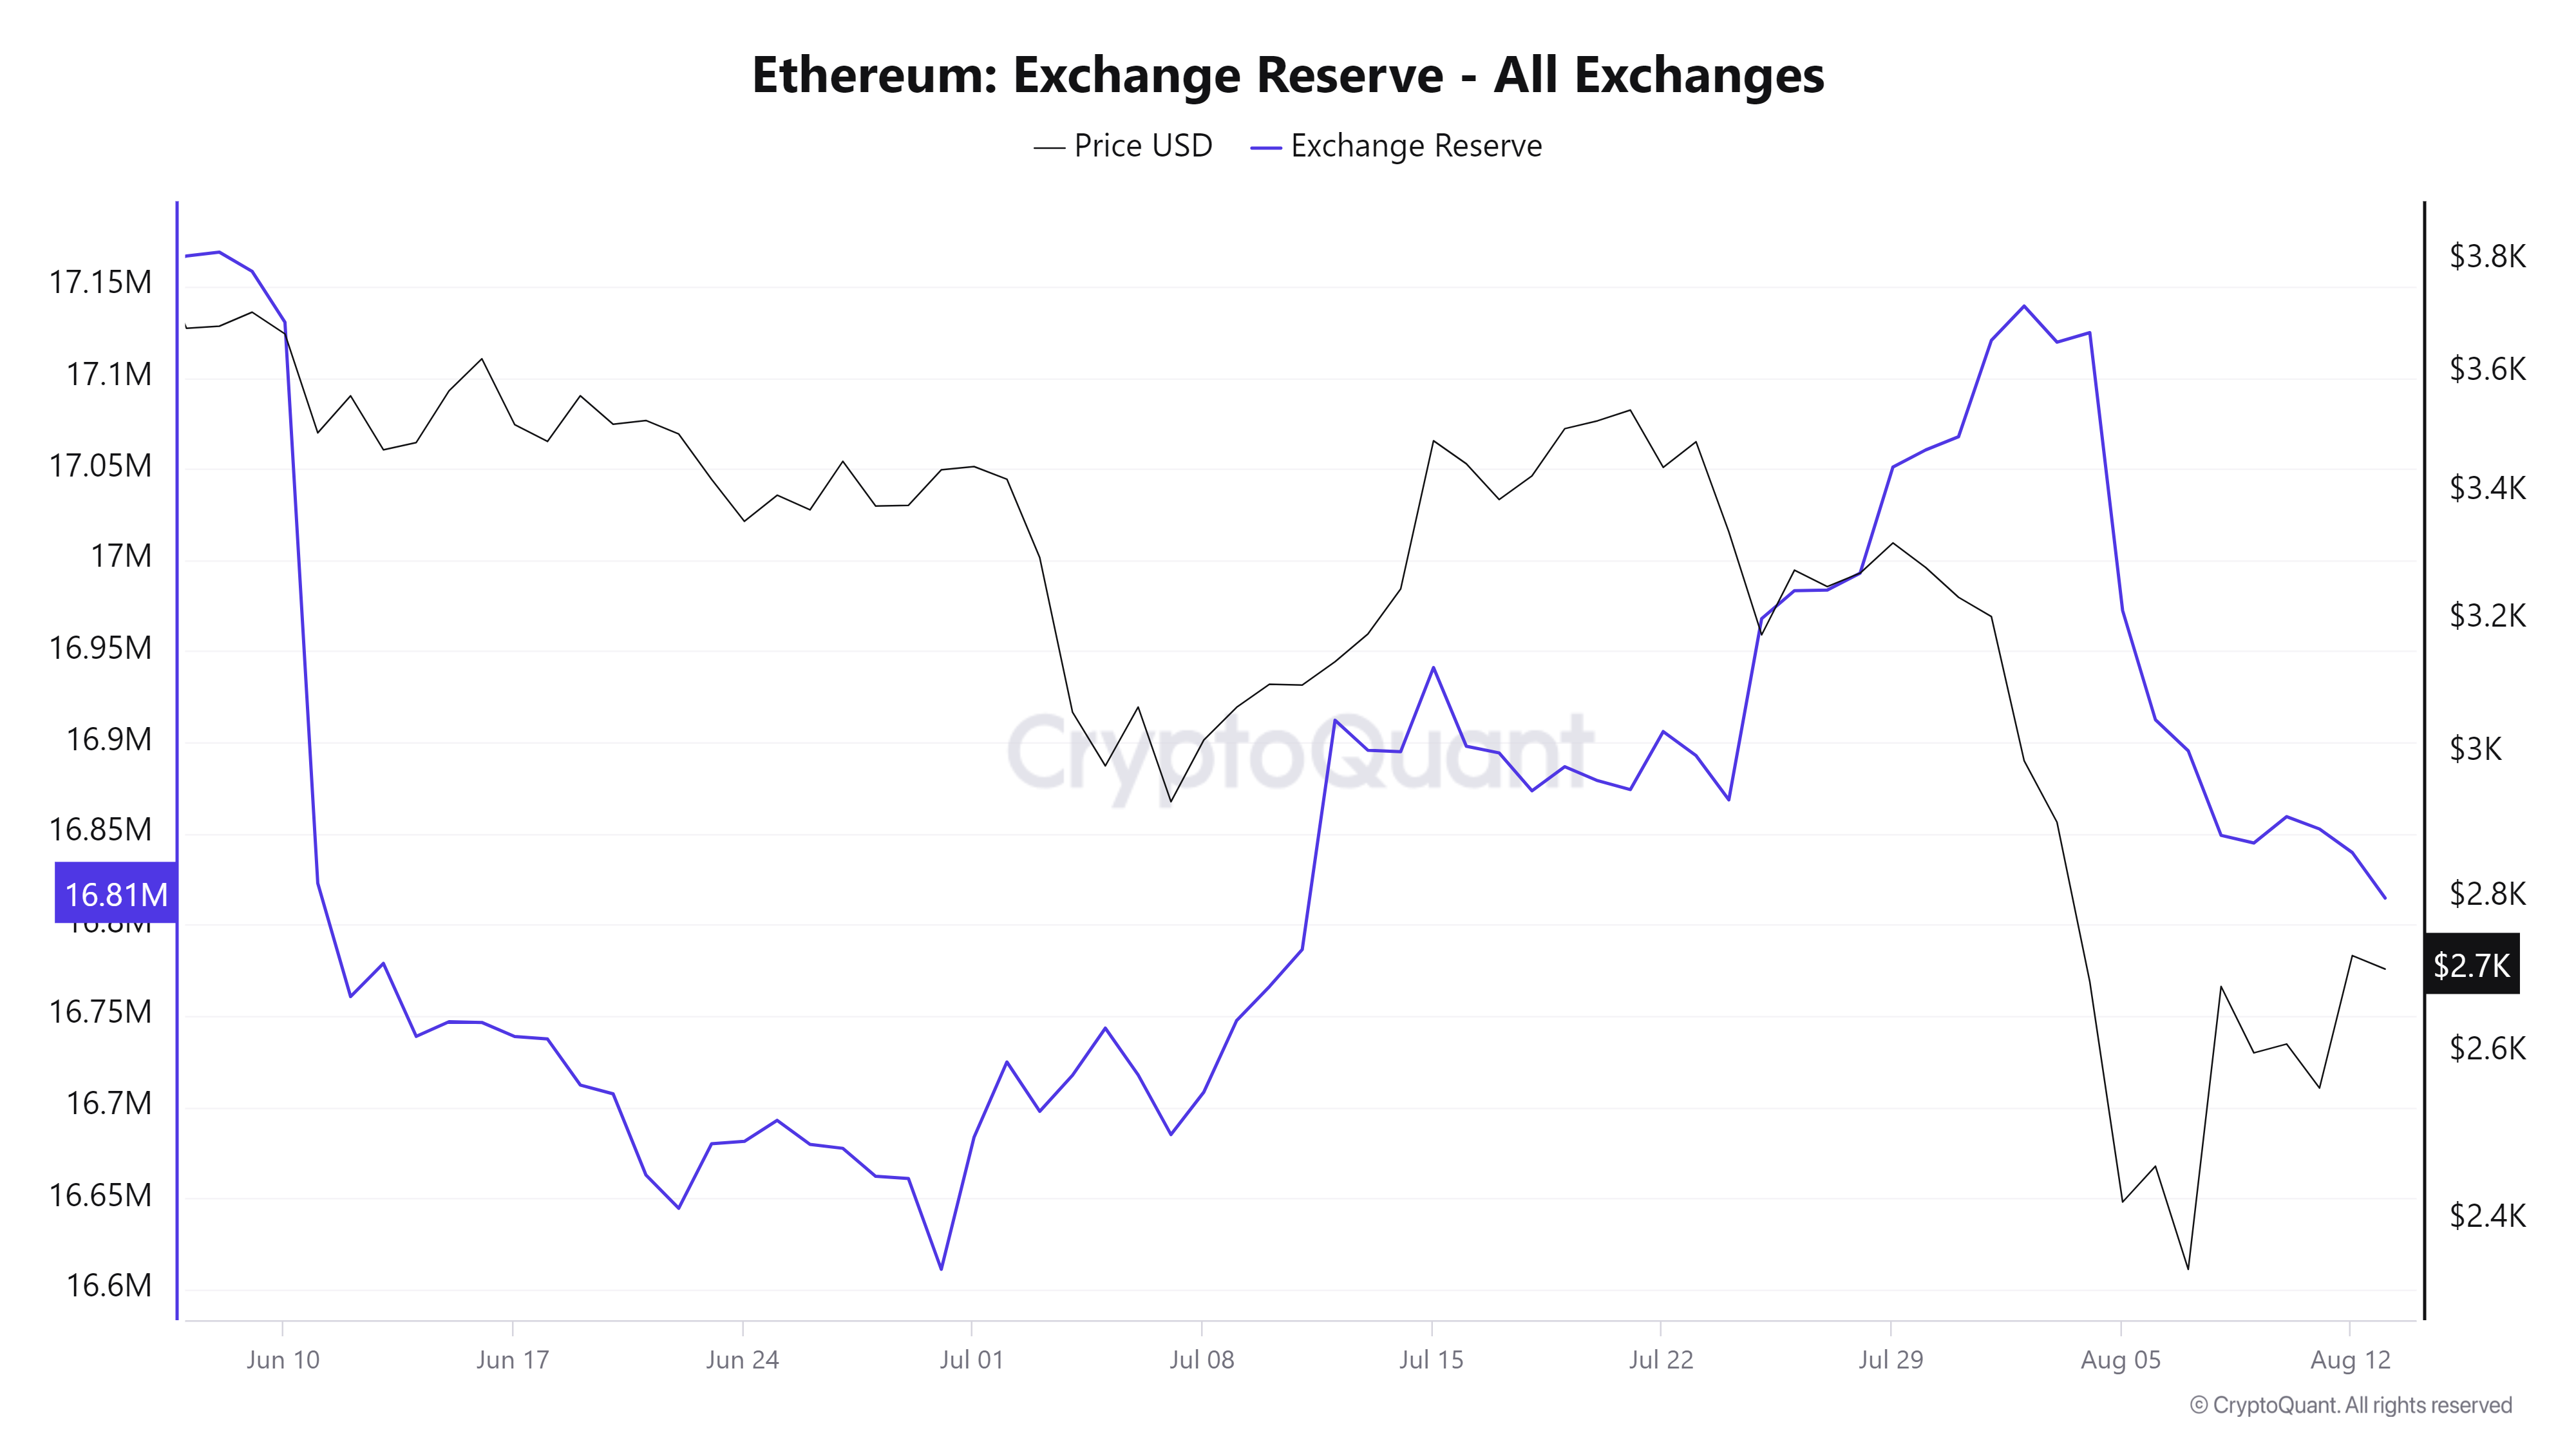
Meanwhile, CryptoQuant's data shows that Ethereum has seen a net exchange outflow of over 306,000 ETH since the market decline on August 5.
ETH's exchange reserves have also depleted to a one-month low of 16.8 million ETH, as it has been in a downtrend since August 2. A decrease in exchange reserves suggests higher buying pressure.

ETH Exchange Reserve - All Exchanges
The increased ETH net exchange outflows and declining exchange reserves suggest investors are accumulating ETH in anticipation of a potential price rally.
ETH technical analysis: Ethereum could approach the $2,000 psychological level
Ethereum is trading around $2,710 on Tuesday, up 2% on the day. In the past 24 hours, it has seen over $27 million in liquidations, with long and short liquidations accounting for $16.29 million and $11.28 million, respectively.
Ethereum's price mimics the cautious sentiment across the crypto market, with a bias toward the downside. This is evident in the ETH Long/Short Ratio, which fell from 1.01 to 0.91, indicating that bears have slightly prevailed over bulls in the past 24 hours.
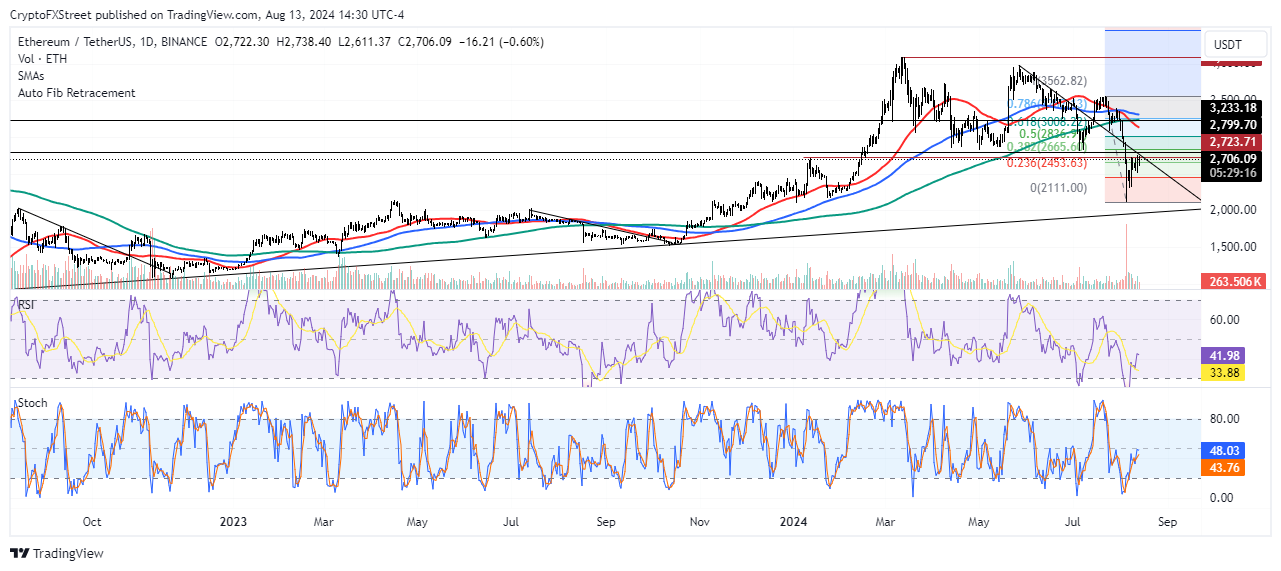
ETH saw a rejection around $2,730, a few cents above the $2,723 key resistance level. The move follows a key trendline suggesting ETH could fall by 25% to record a swing low around $2,020 before rebounding.
As previously discussed, ETH posted similar moves from August 2022 to November 2022 and July 2023 to October 2023, after which it rallied. Hence, the $2,020 price level could be crucial to watch for seller exhaustion and a potential fresh rally in the coming weeks.

ETH/USDT Daily chart
The %K line of the Stochastic Oscillator (Stoch) was rejected at the 50 midpoint and is now at 48, tilting downwards slightly in an attempt to cross below the %D line. Such a move in the Stoch indicates cautiousness, with sentiment tilted toward a short-term bearish move.
The Fibonacci (Fib) retracement suggests ETH could find support at the 23.6% level, which is currently around $2,453. The 23.6% level is one of the key Fib ratios, along with 38.2%, 50% and 61.8%. When an asset's price retraces a portion of its prior move, traders often watch these Fib levels to see if they will act as support or resistance. Hence, if ETH moves below $2,453, it will give credence to the short-term bearish outlook.
An ETH daily candlestick close above the 50% level of the Fib retracement around $2,836 will invalidate the bearish thesis.
 fxstreet.com
