- Ethereum saw a small increase of 1% as it attempted to regain ground back above $150.
- ETH is poised to break beneath the 2-month long symmetrical triangle.
- The bulls must break above $158 to start a short term bull run.
Key Support & Resistance Levels
ETH/USD
Support: $145, $140, $133.50
Resistance: $158.60, $165, $175, $185.
ETH/BTC:
Support: 0.01966 BTC, 0.019 BTC, 0.01850 BTC
Resistance: 0.020 BTC, 0.021 BTC, 0.0215 BTC, 0.0223 BTC
ETH/USD: The Downtrend Seems To Continue
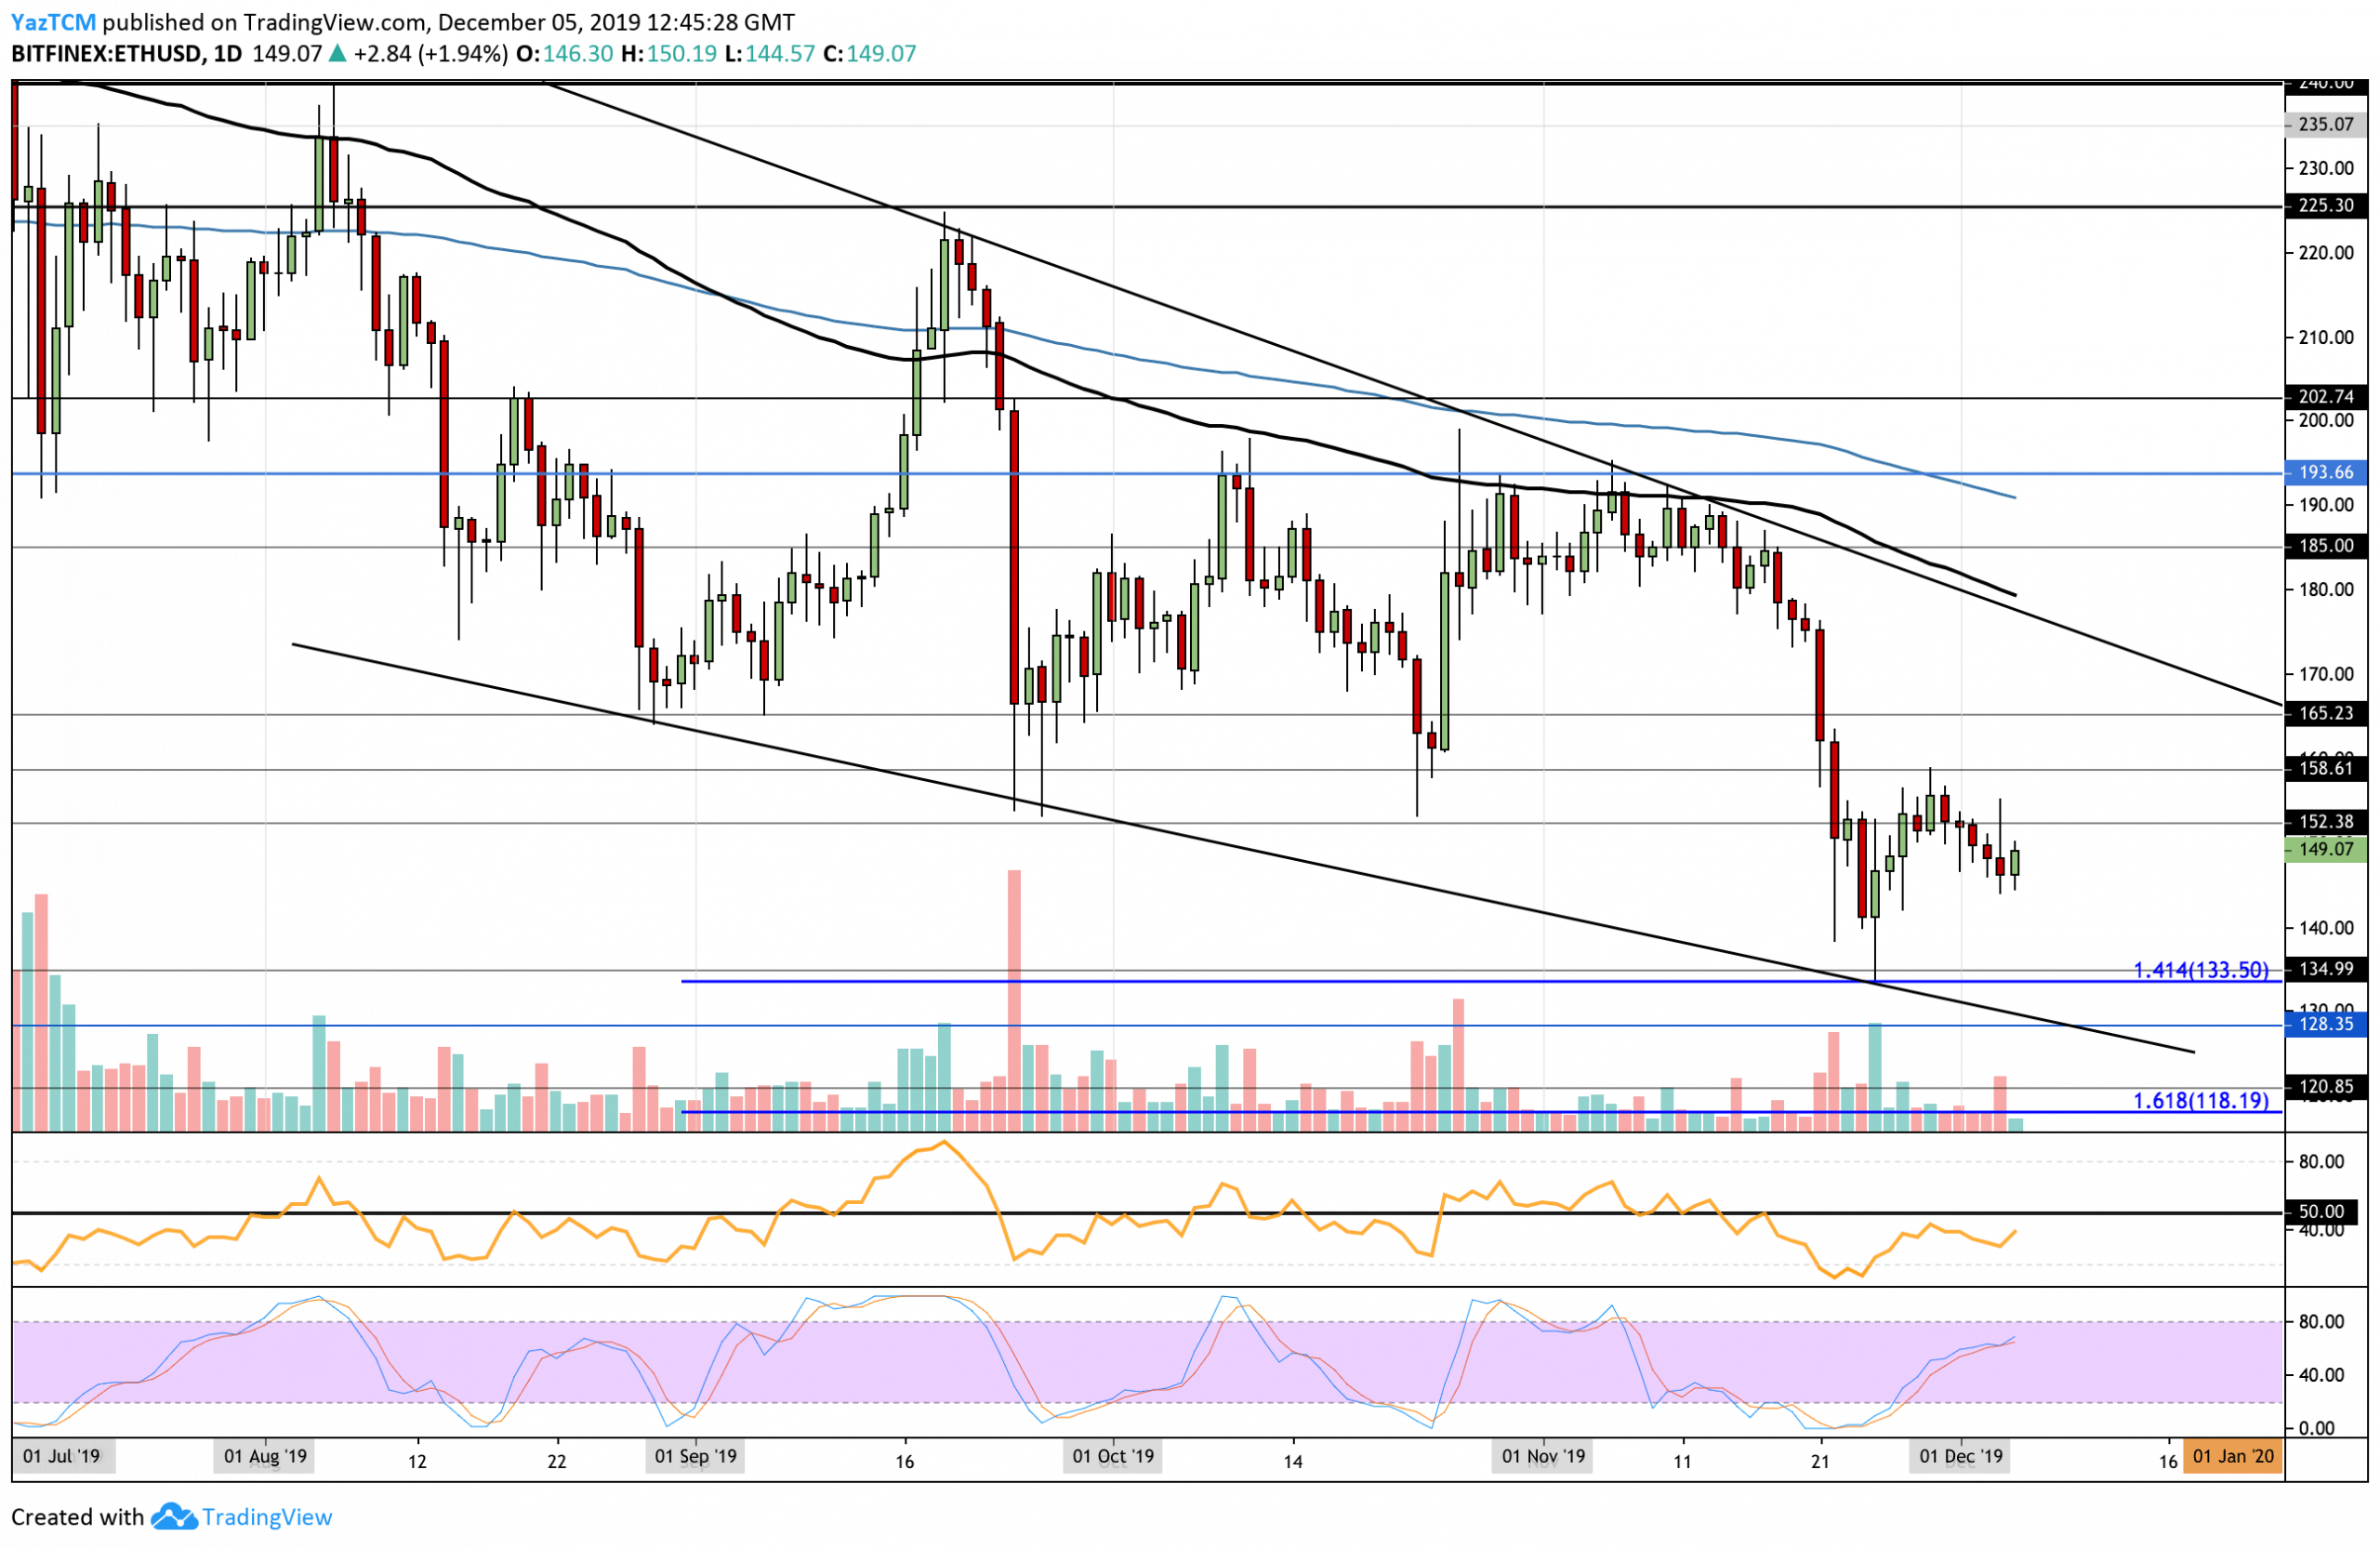
Since our last analysis, Ethereum started to decrease but managed to find support around the $145 area. The cryptocurrency has now bounced higher, largely due to Bitcoin’s recent price hike, as it now attempts to break back above the $150 level.
ETH has been trapped within a descending price channel for a few months and will need to break above this channel for a bullish run to begin. If it can rise above $158, this will be a good sign that a short term bull run is in motion.
Ethereum Short Term Price Prediction
If the buyers start to drive ETH above $150, we can expect immediate resistance to be located at $158 and $165. The $165 level had provided strong support for the market during August and September and is expected to provide an equal level of resistance moving forward. Above this, resistance is located at the upper boundary of the channel at around $175.
Alternatively, immediate support toward the downside lies at $145 and $140. Beneath this, support lies at $133.50 and 4130.
The RSI is rising toward the 50 level which shows that the previous selling pressure may be fading. However, we would need to see the RSI break above 50 if we would like to see ETH breaking above $160.
ETH/BTC: Ethereum Seems Primed For More Pain
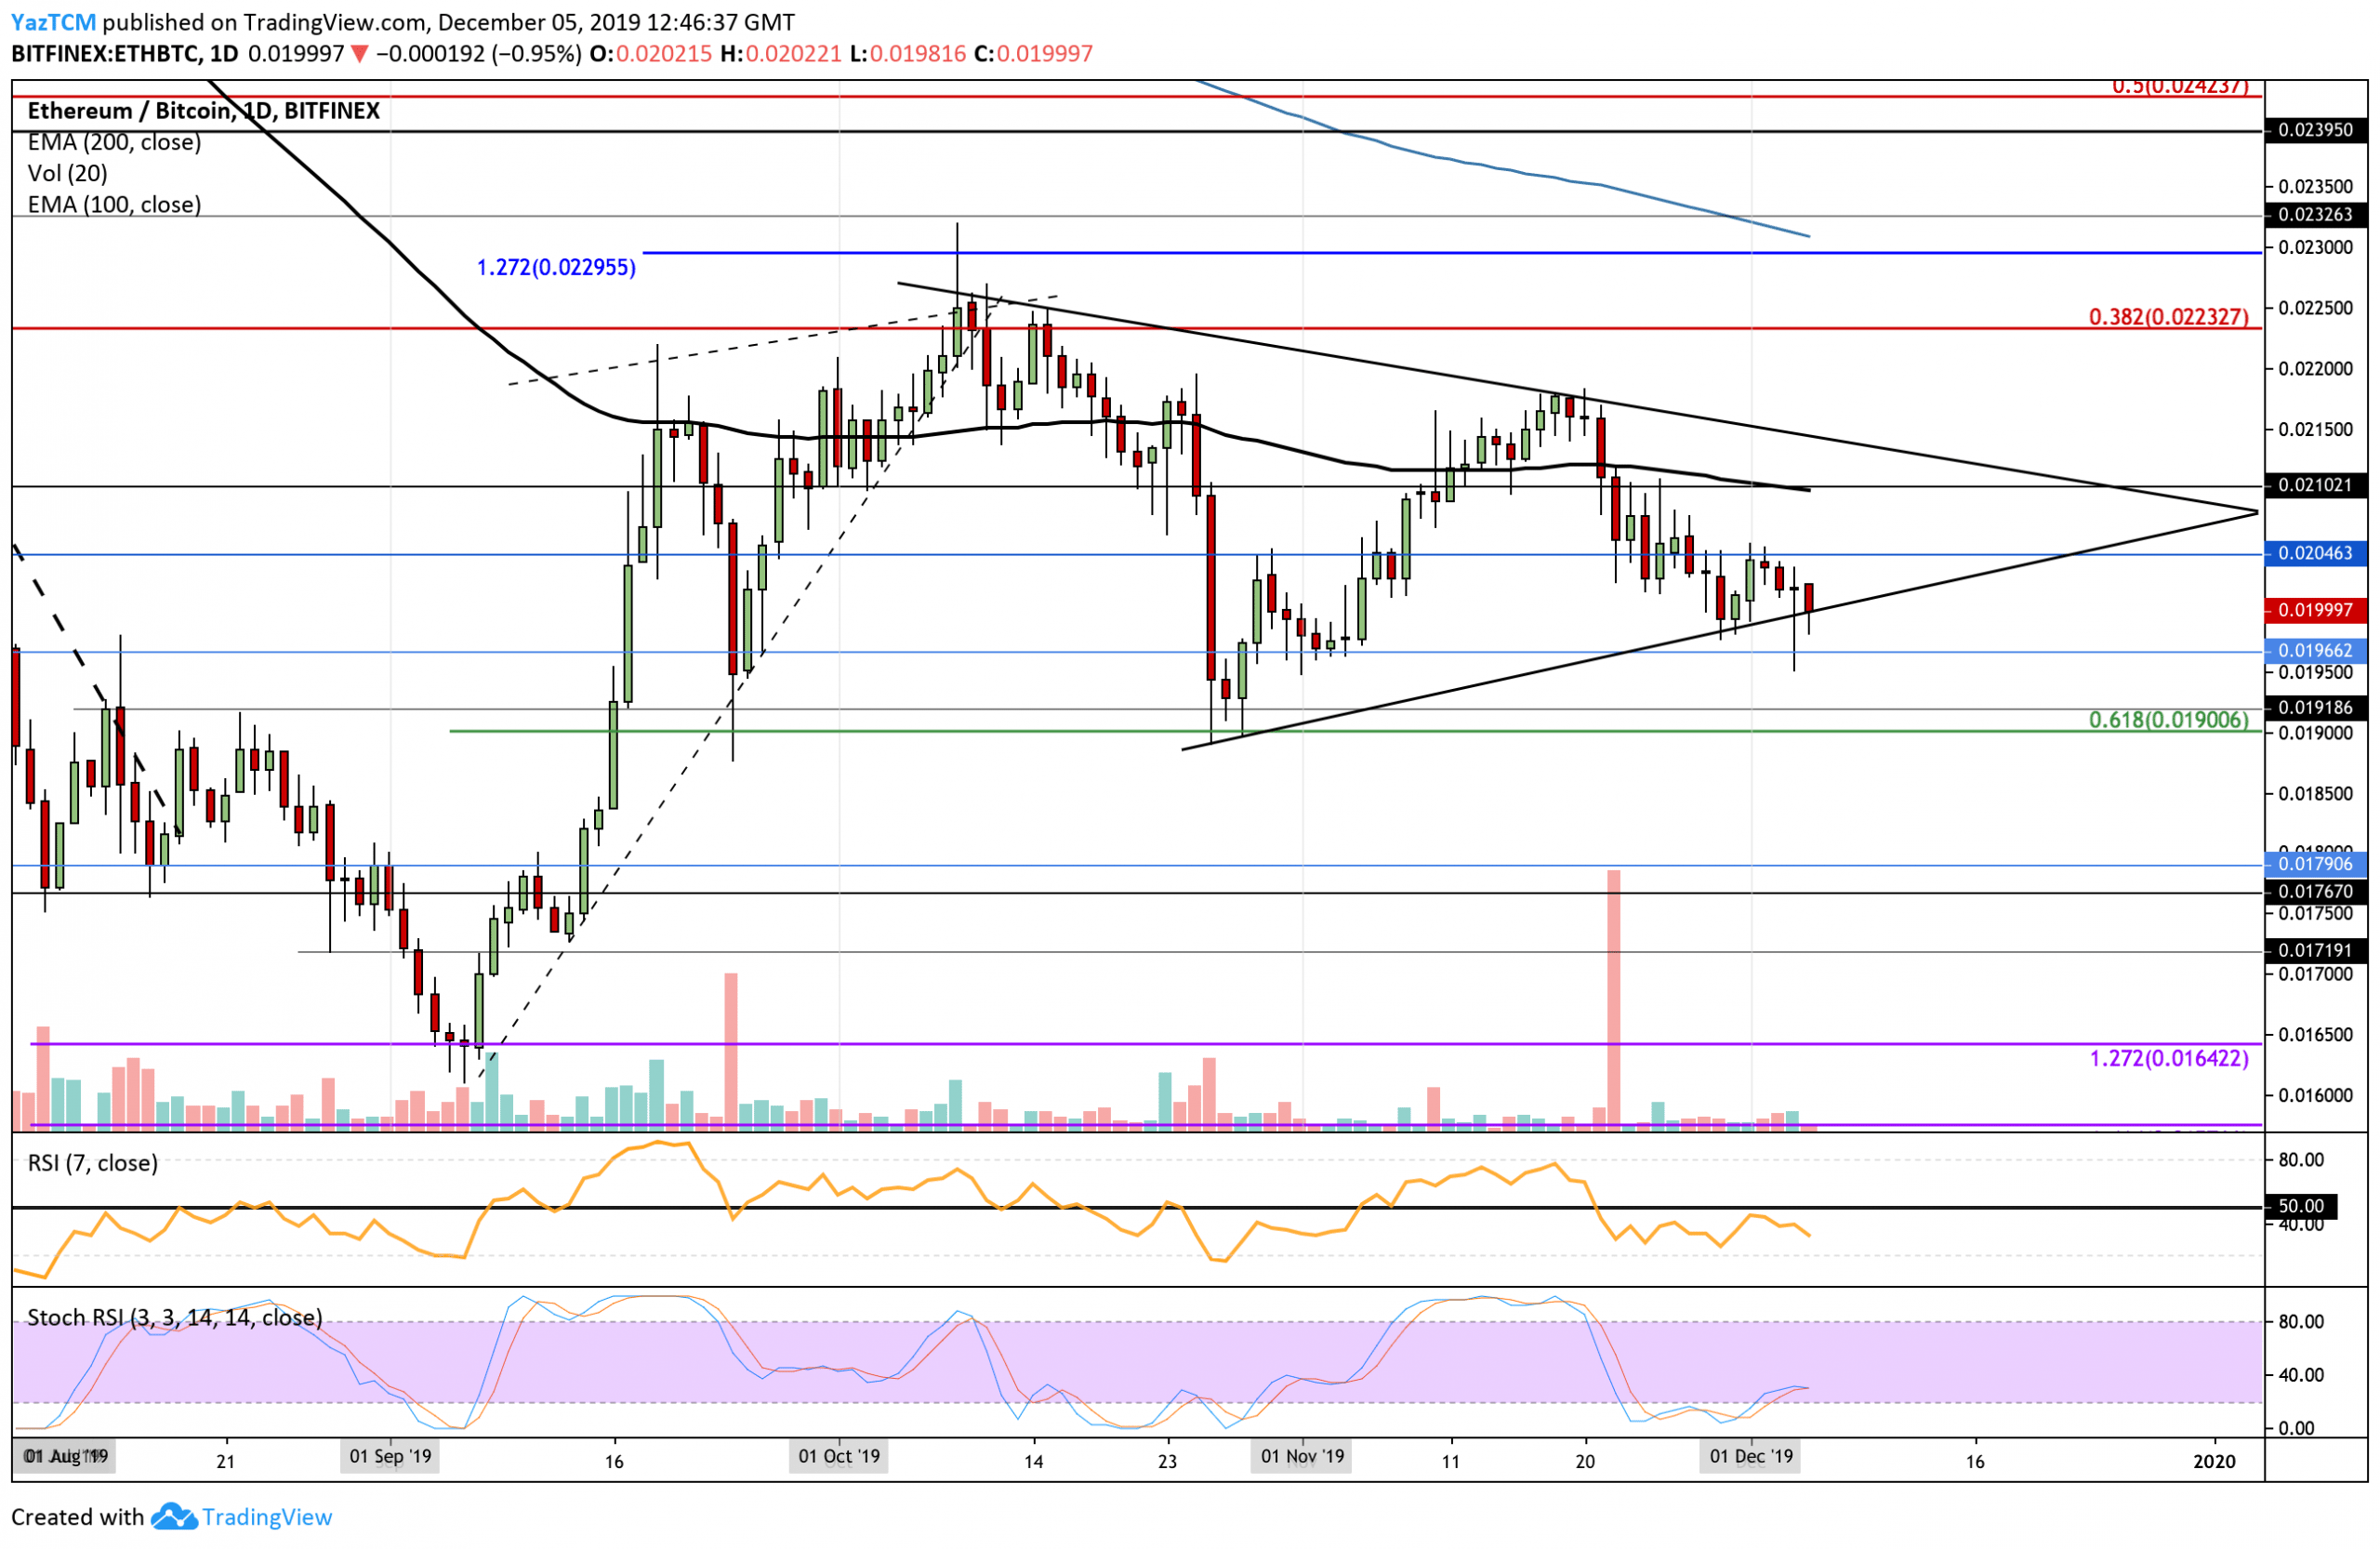
Against Bitcoin, ETH has returned to the lower boundary of the symmetrical triangle as it looks to break beneath. It has been trading within this triangle for over a month now and a breakout was expected to dictate the direction of the next trend. Unfortunately for the bulls, it seems that ETH would like to travel lower against BTC if it breaks beneath that boundary.
Ethereum Short Term Price Prediction
If it drops beneath the boundary, immediate support is located at 0.01966 BTC and 0.019 BTC (.618 Fib Retracement). Beneath this, added support is found at 0.0175 BTC and 0.017 BTC.
Alternatively, if the buyers can hold above the lower boundary of the triangle and bounce higher, we can expect immediate resistance at 0.02 BTC. Higher resistance lies at 0.021 BTC (100-days EMA) and the upper boundary of the triangle (around 0.02140 BTC).
The RSI is trending lower which shows that the sellers are increasing their momentum within the market. The Stochastic RSI is poised for a bullish crossover signal, however, we must be patient for this signal to develop before making any decisions!