$ETH/USD – Ether Breaks 50-day MA
Key Support Levels: $3300, $3150, $3000.
Key Resistance Levels: $3600, $3790, $4000.x
Etheruem found support at $2770 (.786 Fib & 100-day MA) on Wednesday and has been increasing ever since. On Thursday, $ETH managed to break a descending trend line as it passed the 20-day MA to reach the 50-day MA.
Over the weekend, $ETH continued above the 50-day MA as it broke resistance at $3350 reach as high as $3485. It has since rolled over and is now using the 50-day MA as support.
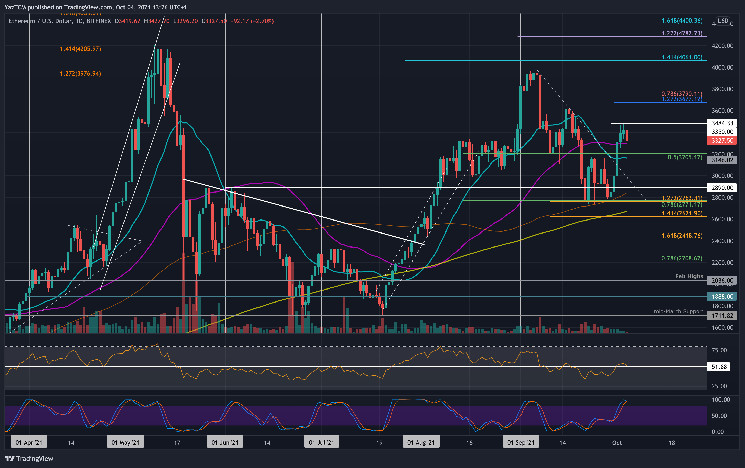
$ETH-USD Short Term Price Prediction
Looking ahead, the first resistance lies at $3485. This is followed by $3600, $3790 (bearish .786 Fib Retracement), and $4000.
On the other side, the first support lies at the 50-day MA, around $3300. This is followed by $3150 (20-day MA), $3000, and $2890.
The RSI is back at the midline after climbing from beneath, indicating the previous bearish momentum has left the market.
$ETH/$BTC – Market Failes At 0.072 $BTC.
Key Support Levels: 0.0691 $BTC, 0.068 $BTC, 0.067 $BTC.
Key Resistance Levels: 0.07 $BTC, 0.0711 $BTC, 0.072 $BTC.
Against $BTC, the cryptocurrency is currently struggling to break resistance at 0.0711 $BTC. The coin found support around 0.068 $BTC last week and started to push higher over the weekend to break the 50-day MA and reach as high as 0.072 $BTC.
Unfortunately, $ETH failed to close a daily candle above 0.0711 $BTC and ended up rolling over from there yesterday to fall back beneath 0.07 $BTC today and reach 0.0691 $BTC.
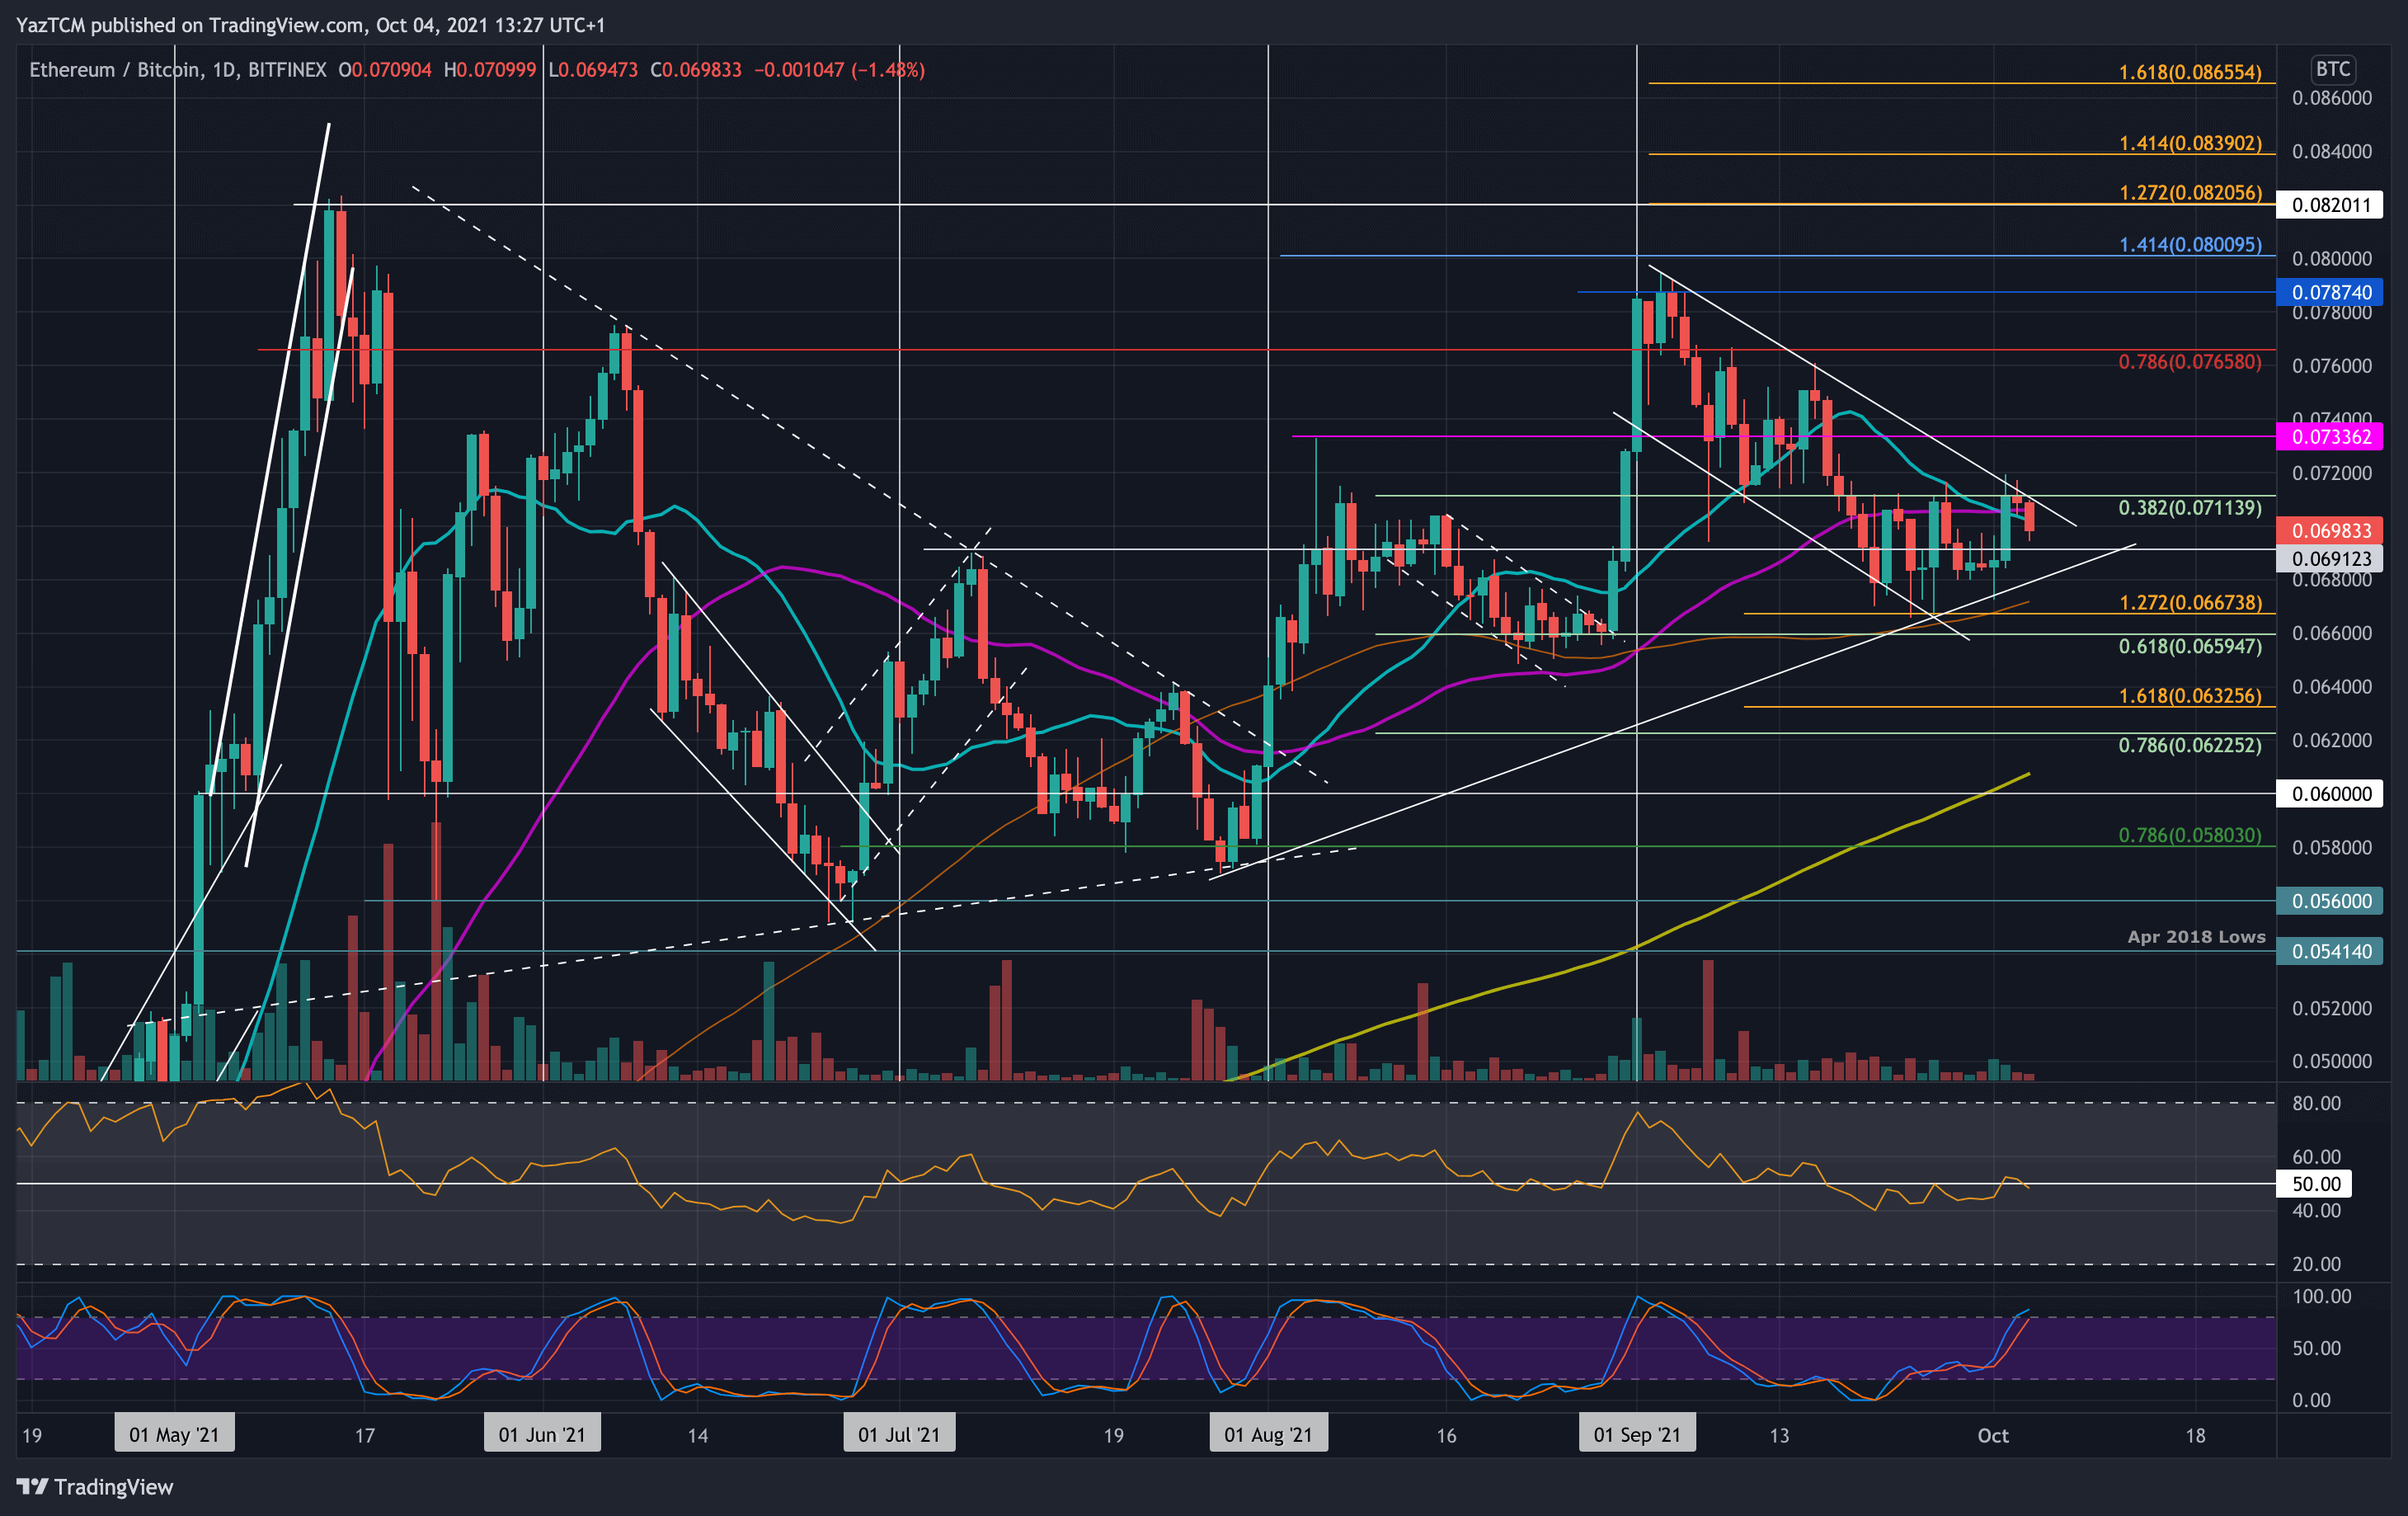
$ETH-$BTC Short Term Price Prediction
Moving forward, the first support lies at 0.0691 $BTC. This is followed by 0.068 $BTC, 0.067 $BTC (100-day MA), and 0.0659 $BTC (.618 Fib).
On the other side, the first resistance lies at 0.07 $BTC. This is followed by 0.0711 $BTC, 0.072 $BTC, and 0.0733 $BTC.
The daily RSI is still beneath the midline, indicating weak bearish momentum in the market.