ETH/USD – Facing Bearish .618 Fib Resistance
Key Support Levels: $3200, $3150, $2950.
Key Resistance Levels: $3350, $3540, $3700.
Ethereum is currently facing the same resistance it struggled with over the past 10 days, at $3350, provided by a bearish .618 Fib. This resistance already led to a retracement during the week as ETH sank to the support levels at $2960, provided by a .236 Fib and the 20-day MA.
Earlier today, ETH recorded its highest price since May 19th: $3,368, according to Bitstamp.
In addition, the last price developments can also be seen as a bullish pattern of inverse head and shoulders, as shown on the following 4-hour chart. The neckline was broken above $3300 and the head is located at $2950 (last week’s low). Following the breakout, we might see ETH spiking to a target of ~$3670-3700, the distance between the neckline and the top of the head.
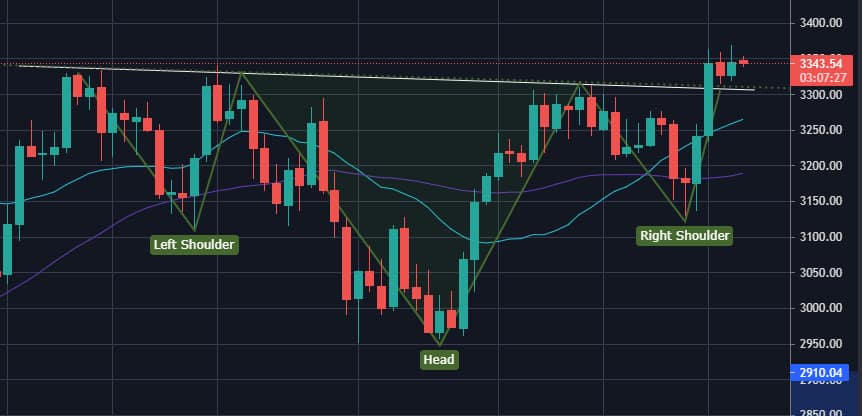
For ETH to continue its extraordinary bullish run, in which it managed to surge by 57% over the past month to outperform BTC, it would need to confirm breakout above the current $3350 resistance area (daily close).
ETH-USD Short Term Price Prediction
Looking ahead, the first resistance lies at $3350 (bearish .618 Fib). This is followed by $3540 (1.618 Fib Extension), $3700 (inverse H&S target and 1.414 Fib Extension – blue), $3790 (bearish .786 Fib), and $3880 (1.618 Fib Extension – blue).
On the other hand, the first support lies at $3200. This is followed by $3150 (20-day MA), $2950 (last week’s low), and $2890 (June highs).
The RSI is starting to climb higher from the midline again, indicating that the bullish momentum rises.
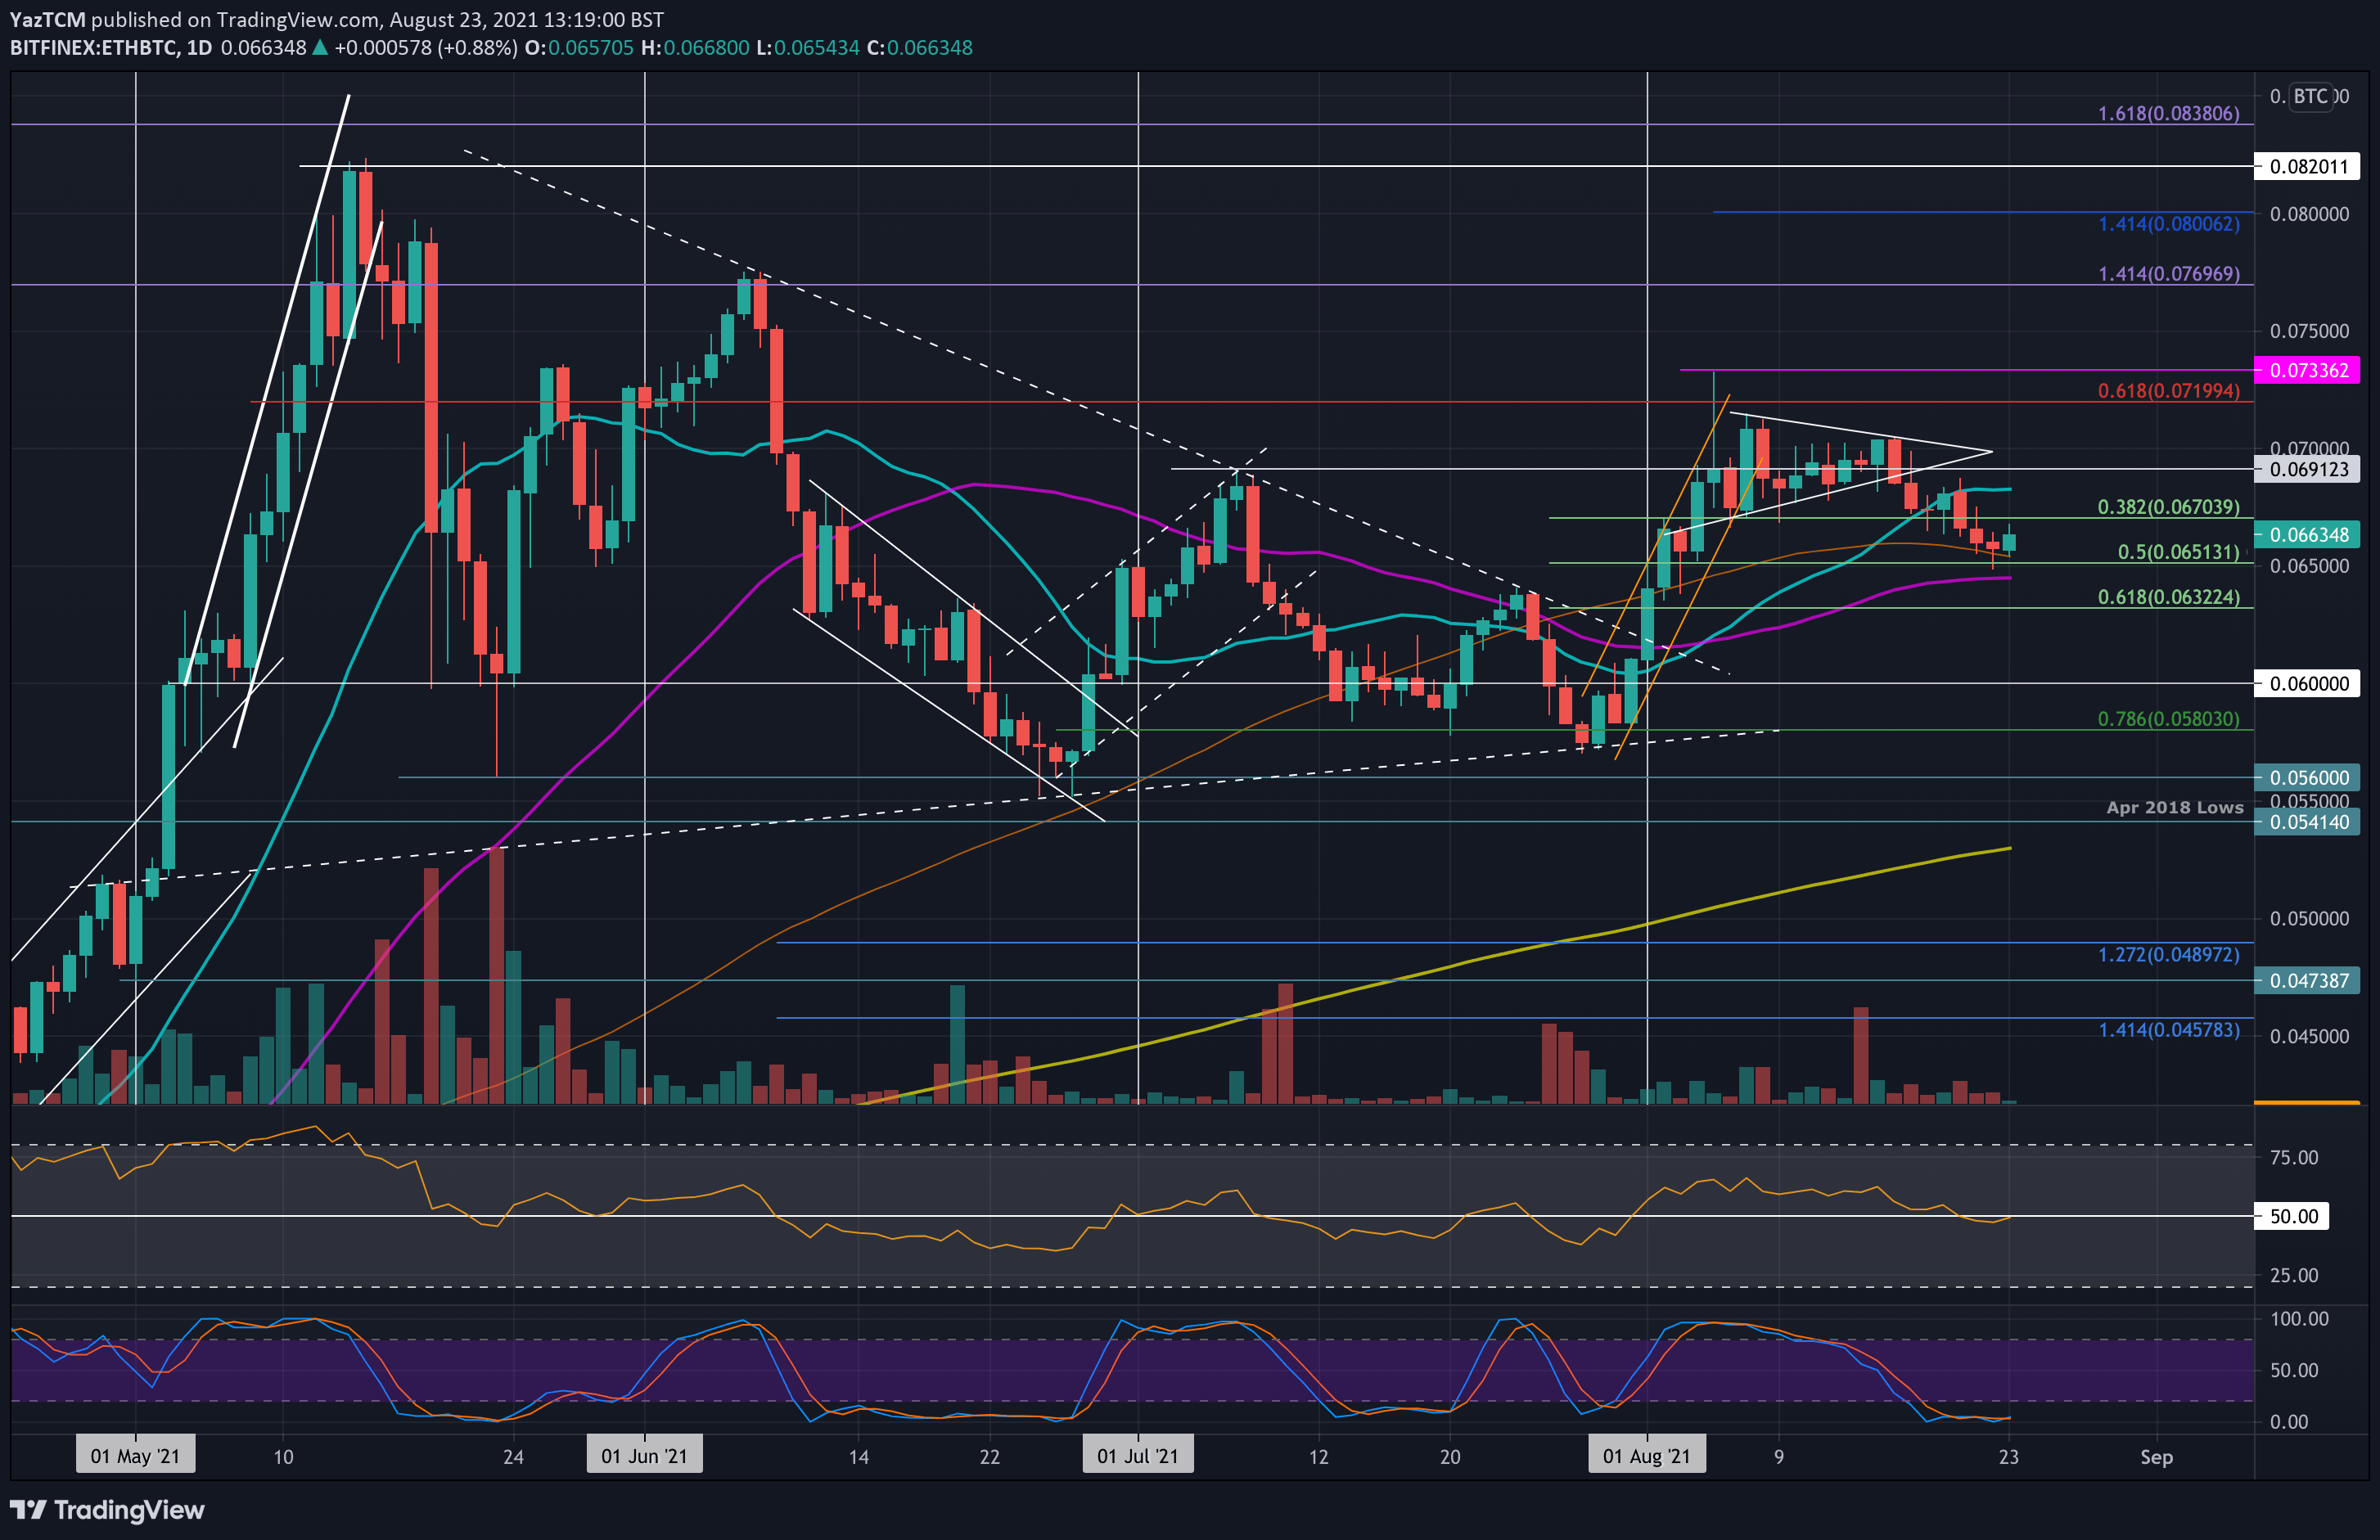
ETH/BTC – ETH Finds Support Upon 100-MA
Key Support Levels: 0.0651 BTC, 0.0645 BTC, 0.0632 BTC
Key Resistance Levels: 0.0682 BTC – 0.069 BTC, 0.07 BTC, 0.072 BTC.
ETH found support amid the 100-day MA line. Last week, the coin fell beneath a symmetrical triangle pattern and started to trend lower in the following days.
It slipped through the 0.067 BTC support (.382 Fib) and continued to decline until reaching support by the 100-day MA (~0.0651 BTC).
Since then, the ETH/BTC pair has bounced slightly, and it will be crucial to hold this week to allow ETH to breach the $3350 resistance (not mentioning “an extra hand” if BTC manages to head higher).
ETH-BTC Short Term Price Prediction
Moving forward, the first support lies at 0.0651 BTC (100-day MA & .5 Fib). The subsequent lines are at 0.0645 BTC (50-day MA), 0.0632 BTC (.618 Fib), and 0.06 BTC.
On the other side, the first resistance stands between 0.0682 BTC (20-day MA) and 0.069 BTC (July high). This is followed by 0.07 BTC, 0.072 BTC (bearish .618 Fib), and 0.0733 BTC (August high).
The RSI is at the midline after falling from the bullish territory, suggesting indecision within the market. It will be crucial for the RSI to push back above the midline to indicate that the bullish momentum is still present.