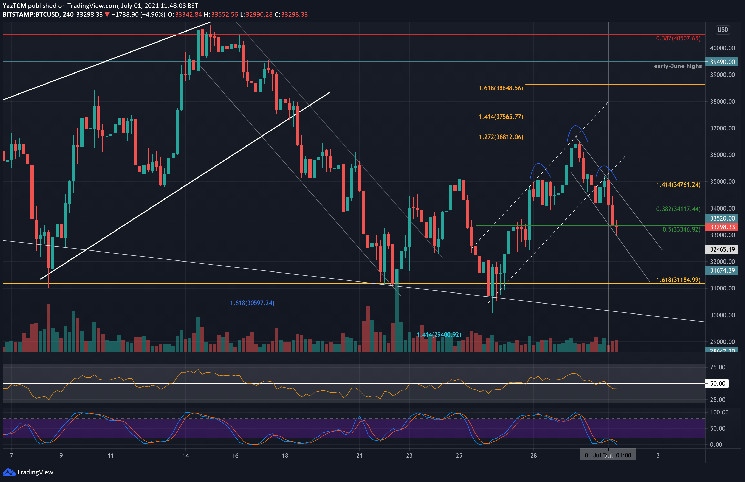
Just as bitcoin started to show some promising signs for the bulls, it rolled over and fell by 5% today, hitting $33,000 – the low as of writing these lines. The primary cryptocurrency looked hopeful as it traded inside a short-term rising price channel since double-bottoming at $31.5K over the weekend.
The price channel allowed BTC to hit a 12-day high at $36.6K on Tuesday, but the volume was not increasing and BTC reversed after failing to close a daily candle above the 20-day moving average line (MA). Since then, the cryptocurrency broke beneath the rising price channel and found support at $34,115 (short-term .382 Fib) toward the end of the day.
Today, BTC attempted to push higher and retested the price channel – this time as resistance. However, bitcoin got heavily rejected, and as mentioned above reached as low as $33K earlier.
Overall, if $32.5K doesn’t hold, which is the previous higher low of the 4-hour chart, then we can expect another retest (sixth since May) of the $30-31K support area. On the other hand, if BTC can sustain this price area, then the first major resistance is a daily close above the MA-20 line, currently at $35.4K.
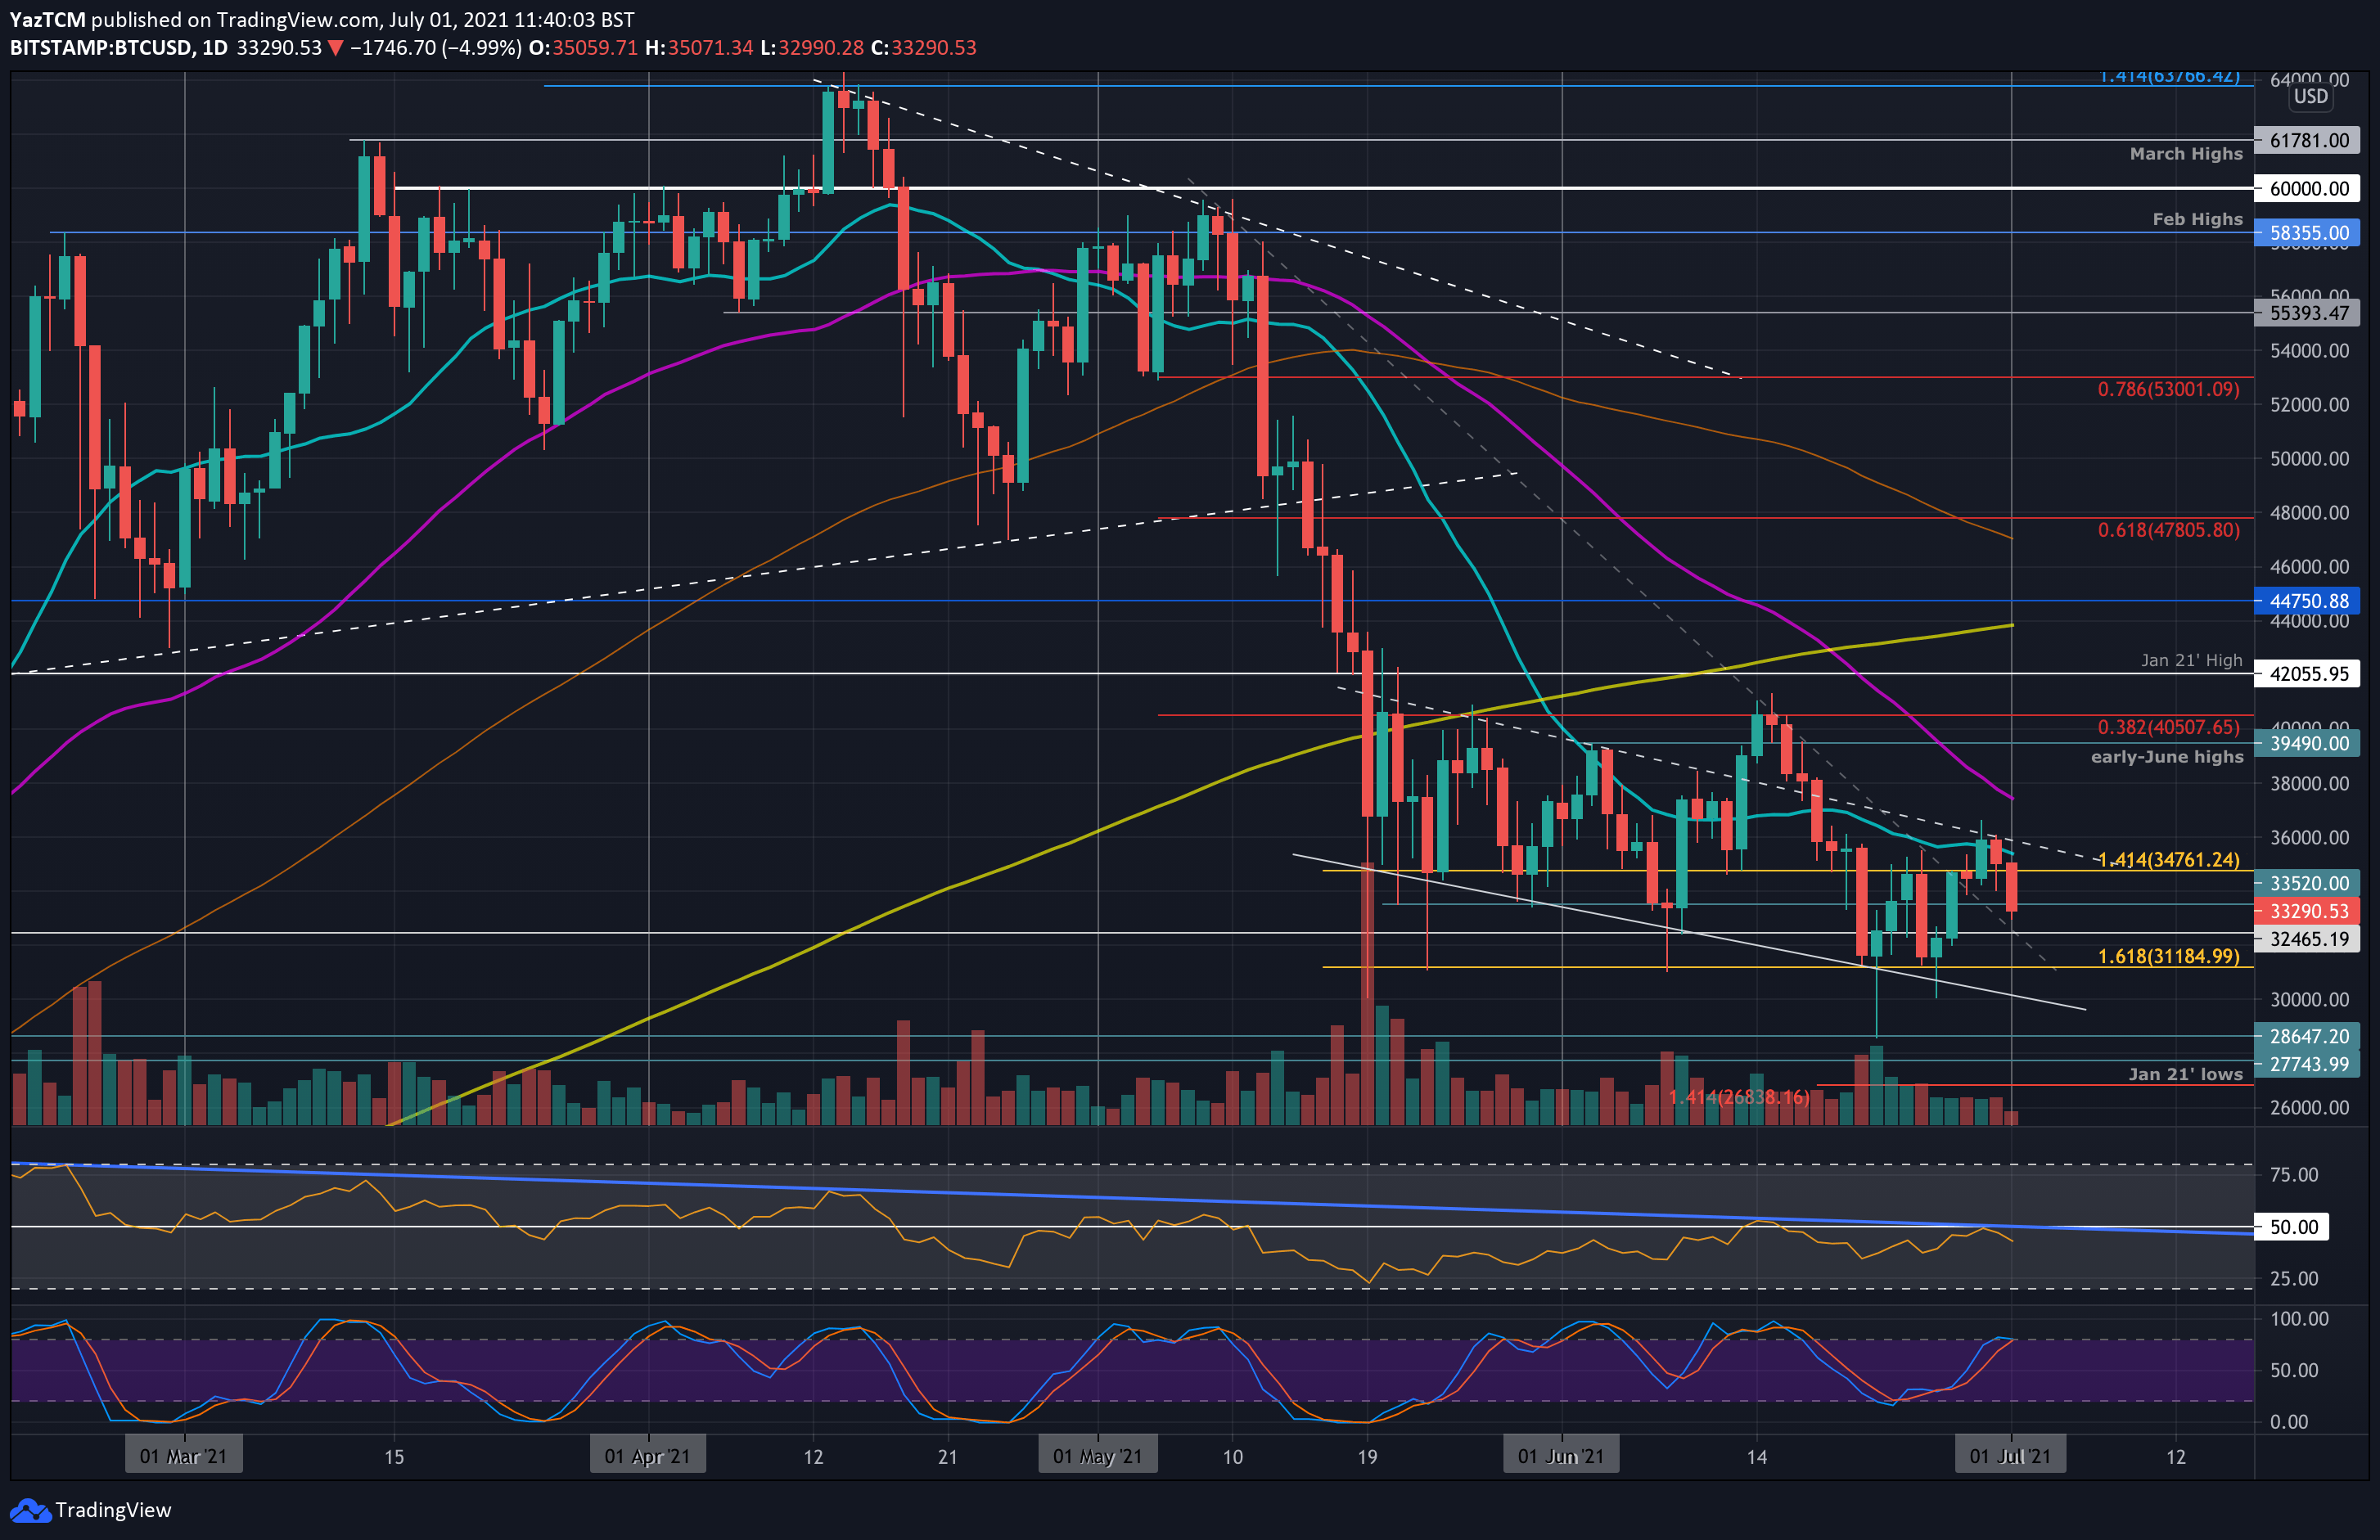
Another thing to note is the longer timeframe. Since mid-May, Bitcoin is trading inside a range between $30K and $42K. Until a clear breakout, the coin is expected to chop some long and short positions.
BTC Price Support and Resistance Levels to Watch
Key Support Levels: $33,000, $32,460, $31,675, $31,185, $30,600.
Key Resistance Levels: $34K, $35,420, $36,600, $37,460.
Looking ahead, the first support now lies at today’s low of $33,000. This is followed by $32,460 (as mentioned above), $31,675, $31,185 (downside 1.618 Fib Extension), $30,600 (weekend support) and $30,000.
On the other side, the first resistance lies at $34K. This is followed by $35,420 (20-day MA), $36,600 (weekly high), and $37,460 (50-day MA).
The daily RSI has consistently produced lower highs (falling blue trendline) since the end of February, the last lower high took place on Tuesday, following the $36K rejection. This falling trendline indicates that the bulls have failed to establish increasing momentum each time a rally started, and it could be an indicator that they are quickly running out of steam.
A break above this trendline would be the first signal that bullish strength is starting to return to the market.
Bitstamp BTC/USD Daily Chart
Bitstamp BTC/USD 4-Hour Chart