On Oct 28, Bitcoin (BTC) was subject to a sharp drop that took the price from a high of $13,864 to a low of $12,892.
Despite the fact that the price is trading above support, the price action suggests that BTC will eventually drop lower.
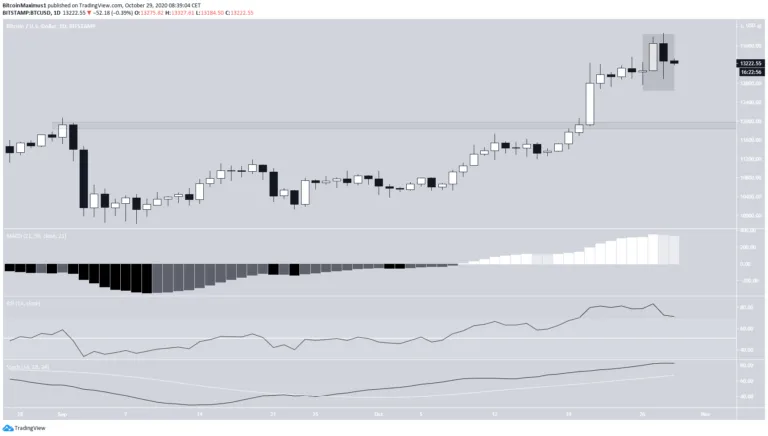
Bitcoin Takes a Tumble
Yesterday, BTC was in the process of creating a bearish engulfing candlestick, reaching a low well below the prior day’s opening price. However, BTC bounced and created a long lower wick. While the candlestick is still a sign of weakness, it does not confirm the top, and neither do any technical indicators.
While the MACD has begun to slightly decrease, it has only created one lower bar up to this point. The RSI has also begun to decrease but has failed to generate any bearish divergence and the Stochastic oscillator has not yet begun to decrease.
If BTC does drop, the closest support area would be found all the way down at $12,000. For the time being, there are no clear signs in the daily time-frame that BTC will do that.
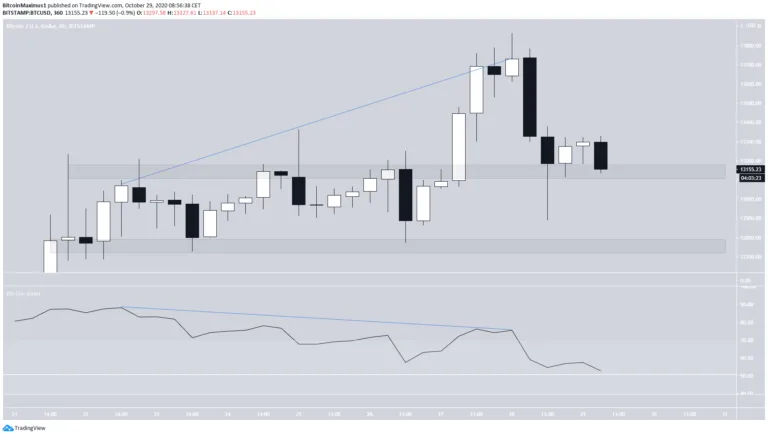
Trading Range
The six-hour chart shows that the drop was preceded by a considerable bearish divergence in the RSI.
This caused BTC to drop to the previous resistance area of $13,130, which has now turned to support. If the price breaks down, the next support area would be found at $12,770, the final support level before the aforementioned $12,000 long-term support.
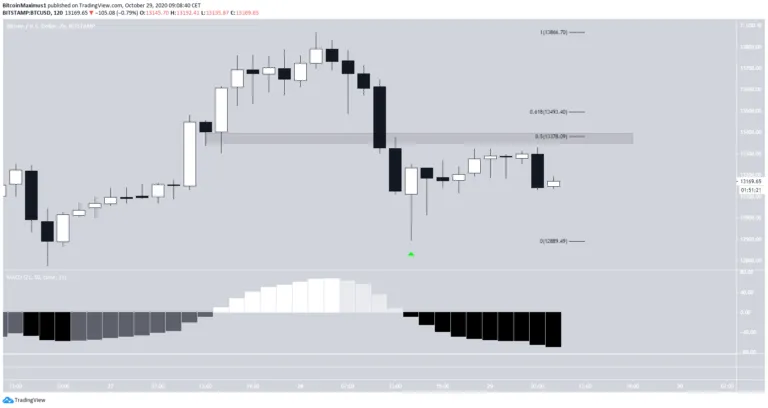
Despite the bounce at the resistance-turned-support area at $13,130 and the creation of a bullish hammer candlestick, the bounce looks to be corrective. This possibility is strengthened when considering that BTC has failed to reach the 0.5 Fib level of the decrease at $13,378, an area that has now turned to resistance.
Unless the price somehow manages to flip the 0.618 Fib level of the decrease at $13,493, a drop towards the aforementioned support at $12,730 seems the more likely option.
Wave Count
BTC began a bullish impulse on Sept 7 (shown in orange below) and has completed an extended wave 3 with yesterday’s high.
Therefore, the price has likely begun wave 4, which is corrective. The most likely level for wave 4 to end would be between $12,083-$12,442, the 0.382-0.5 Fib levels of the entire upward move. These levels also coincide with the resistance line of a parallel channel connecting the top and bottom of waves 1-2, making it a likely level for wave 4 to end.
Considering that wave 2 was sharp and deep (red circle), we would expect the opposite in wave 4 because of the property of alternation.
Therefore, a correction that lasts for at least half of the period of time it took for wave 3 to be completed (33 days) would be common.
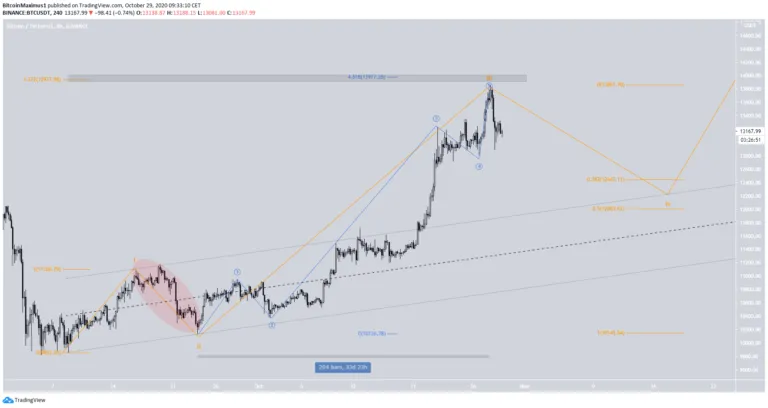
To conclude, Bitcoin has likely begun a corrective wave which is expected to eventually take the price towards $12,083-$12,442.
For BeInCrypto’s previous Bitcoin analysis, click here!
Disclaimer: Cryptocurrency trading carries a high level of risk and may not be suitable for all investors. The views expressed in this article do not reflect those of BeInCrypto.