Bitcoin bulls are trying to regain lost ground after failing to break the high set back on June 26, 2019, at $13,880.
This would’ve been the highest price Bitcoin has reached in over 490 days, however, heavy selling pressure and a weakening uptrend caused prices to tank over 7% in under 12 hours. Right now, the leading crypto is back inside a rising channel pattern and stuck under the median line resistance (white dashed middle line on the following chart).
Over $17 billion has been stripped from the crypto market since yesterday’s steep correction but overall the global market capitalization is still printing higher lows – according to data by CoinGecko. This is a promising sign and implies that overall sentiment is still favorably bullish.
BTC Price Levels to Watch in the Short-term
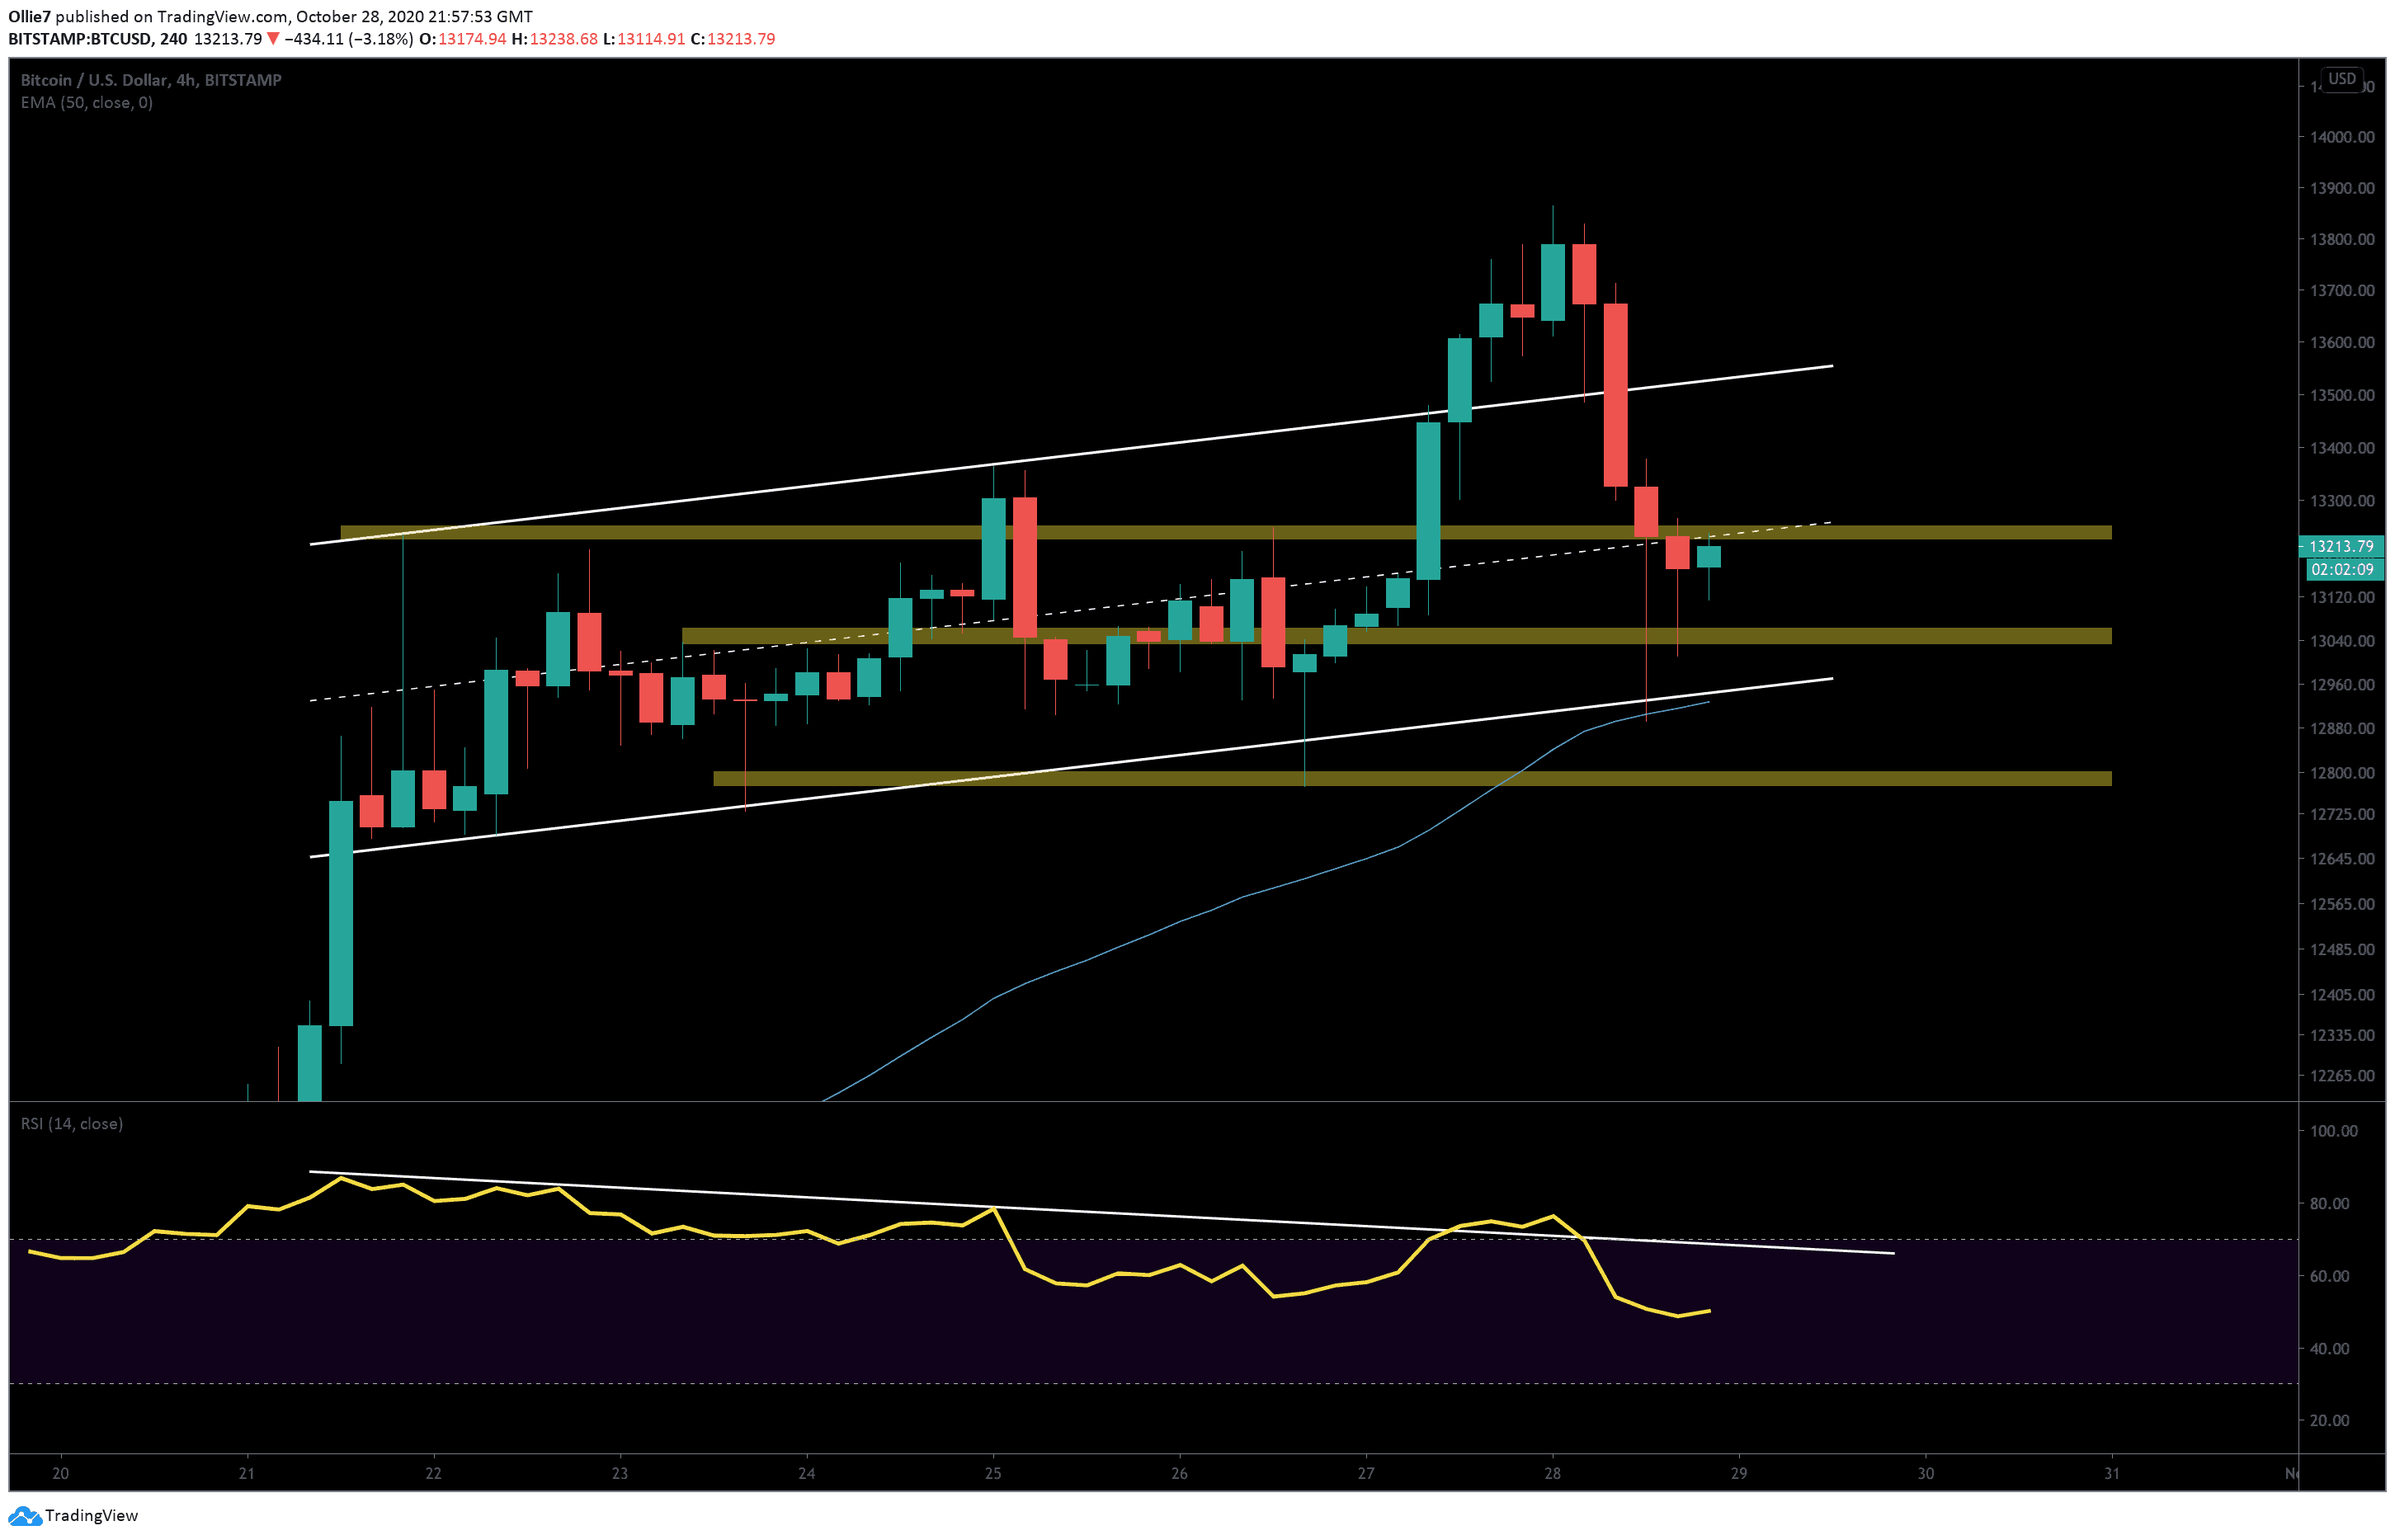
On the following 4-hour BTC/USD chart, we can see that the 50-EMA line (blue) successfully caught the bottom of the Bitcoin crash and allowed bullish traders to drive prices back up $200 before running into resistance at the median line.
Despite a number of attempts from bears to defend this particular level over the course of today’s trading session, the long wicks beneath the last 3 candles suggest bulls are carrying more momentum.
If this strength can sustain and bulls manage to overcome this first hurdle, we should expect to see the next set of resistances around the $13,300 and $13,500. After this, Bitcoin buyers will have to contend with the main channel resistance which has been a strong S/R level for the asset over the past 6 days.
If bears manage to overcome the current buying pressure and start a second breakout to the downside then we should expect to see a reaction at the first main support zone (middle yellow bar) around $13,050 followed by the main channel support at $12,950. It’s worth noting that this particular support is also being reinforced by the 50-EMA which has already proven itself to be a reliable resource for bullish traders.
Looking underneath this area, there’s a second main support zone (bottom yellow bar) around $12,800 which should also provide a strong foothold for bitcoin buyers to relaunch from.
The RSI continues to print lower lows although the surge towards the 490-day high yesterday did manage to briefly break through the resistance line (yellow) for the first time this week. This indicator line should be watched carefully over the next few days; if we see a new higher low appear it could be an early indication that the trend is growing stronger again.
Total market capital: $400 billion
Bitcoin market capital: $245 billion
Bitcoin dominance: 61.4%
*Data by CoinGecko.
Bitstamp BTC/USD 4-Hour Chart