
 en.cryptonomist.ch

With oil-driven inflation fears weighing on risk assets, Bitcoin at a crossroads: bears hold the daily while bulls fight for footing near $62,700 encapsulates the uneasy equilibrium as $BTC trades at $62,734 on July 13, 2026, with the Fear & Greed Index slumped to 28.
Key takeaways
- Bitcoin trades at $62,734 with the daily RSI at 47.37 and price trapped below all three major moving averages
- The Fear & Greed Index has fallen to 28, signaling deep fear across the crypto market as oil-driven inflation fears mount
- Strategy raised its reserve to $3 billion while simultaneously executing its largest-ever $BTC sale of $216 million, creating ambiguous institutional signals
- A break above the daily pivot at $63,086 could target $65,386, while losing $62,101 exposes $61,748 and potentially $58,397
Bitcoin’s Daily Regime: Structurally Bearish, But Not Broken
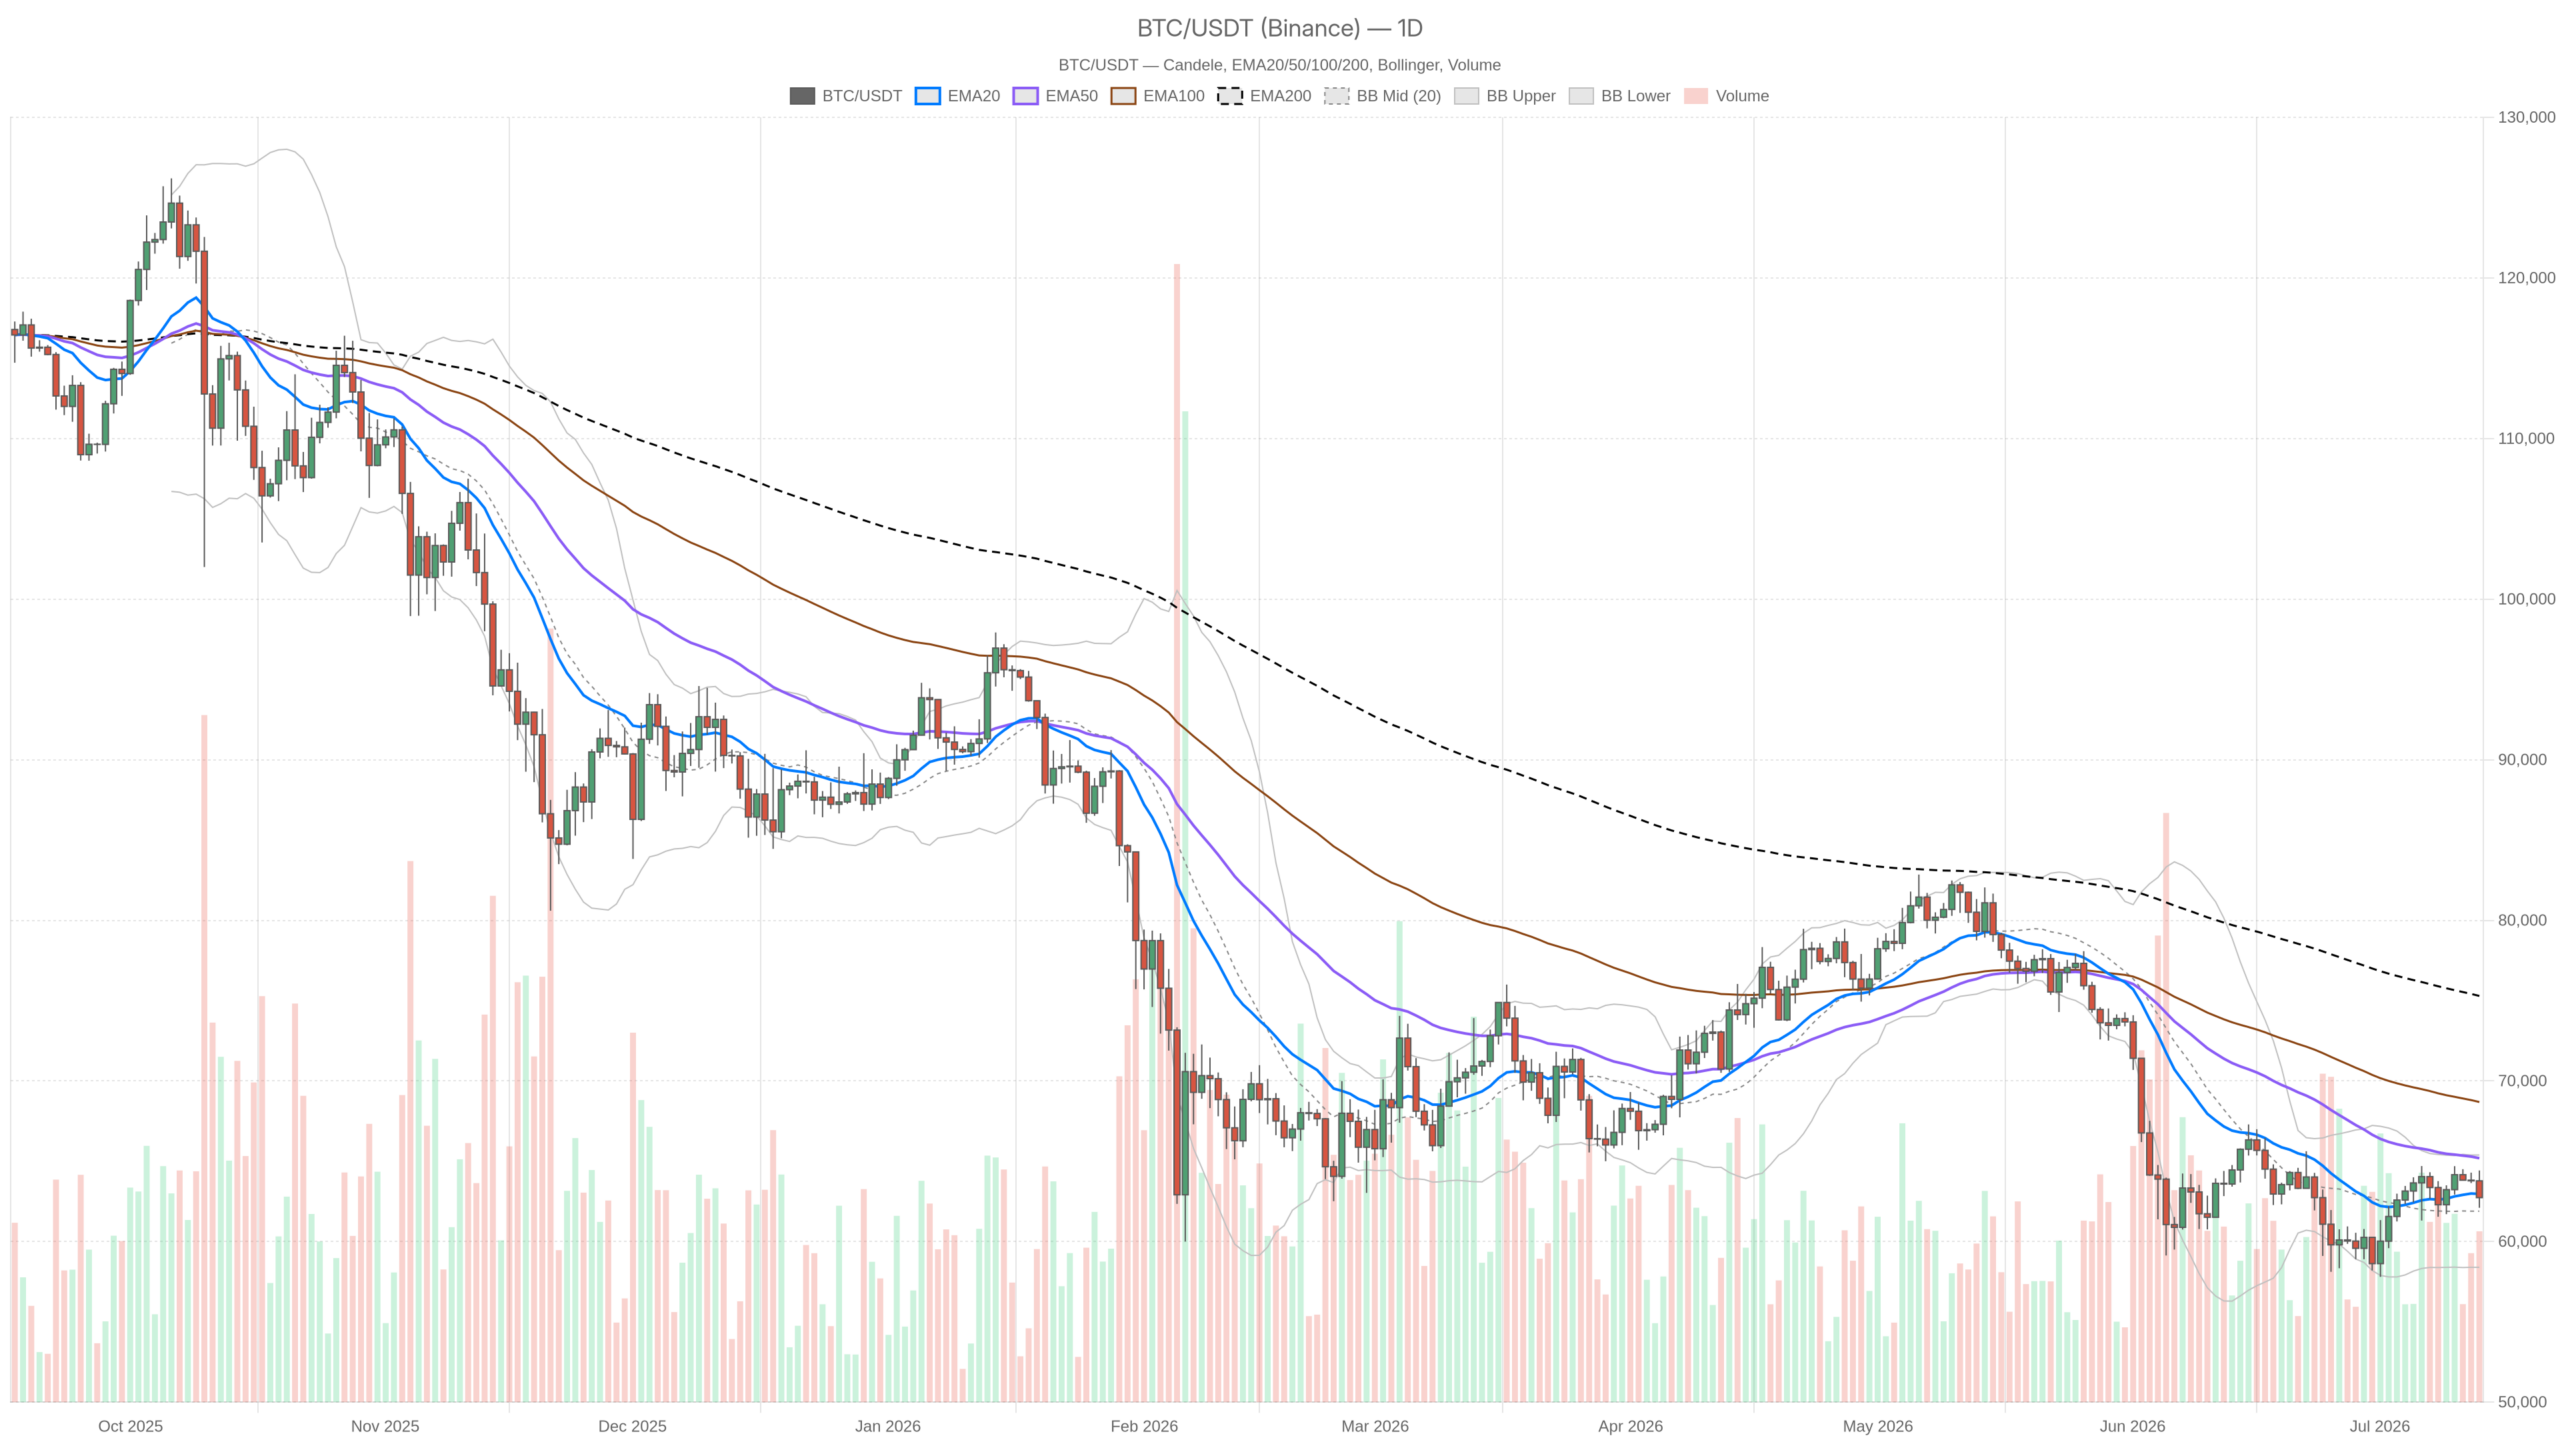
Bitcoin’s daily chart remains structurally bearish but is not broken. Price sits below all three major moving averages, yet the MACD histogram turning positive signals that downside momentum is decelerating rather than accelerating. At $62,734, $BTC trades beneath the EMA20 at $62,965 and the EMA50 at $65,188, with the EMA200 standing a full $12,500 overhead at $75,291. This alignment, with the EMA200 acting as a distant ceiling, defines the anatomy of a downtrend rather than a recovery.
The daily pivot point sits at $63,086, just above current price, reinforcing that Bitcoin is pressing on the wrong side of near-term equilibrium. The daily RSI at 47.37 hovers just below the neutral 50 line. It has not collapsed into oversold territory but is also not recovering with any conviction. This is the behavior of a market that keeps finding sellers into mild bounces rather than building genuine momentum.
The MACD tells a more nuanced story: the line is negative at -238.51 and the signal is deeply negative at -664.46, but the histogram has swung to a positive +425.95. That histogram divergence means the rate of bearish pressure is decelerating. It is not a buy signal — it is a less-bad signal. The trend remains down, but it is losing steam at this level.
Bollinger Bands on the daily frame have the midline at $61,892, the upper band at $65,386, and the lower band at $58,397. Current price sits between the midline and upper band, which is mildly constructive. However, with price still capped below the upper band and well beneath the EMA50, any rally into the $64,000–$65,386 zone would run directly into layered resistance. The daily ATR of $1,937 confirms this is a high-volatility environment where moves of $2,000 in either direction fall well within normal range.
Hourly Picture: Neutral on the Surface, Stressed Underneath
The 1-hour chart appears neutral but reveals a bearish EMA structure underneath. Price at $62,739 sits below the EMA20 at $63,099, the EMA50 at $63,491, and even the EMA200 at $63,165. Every short-term average is overhead — this is a bearish EMA stack, regardless of the neutral regime label the broader chart might suggest.
The 1H RSI at 39.54 flirts with oversold without quite getting there, a level where sellers remain in control but exhaustion is building. Moreover, the 1H MACD is outright negative: the line at -329.91 has crossed below the signal at -305.82, and the histogram of -24.09 shows the divergence is still widening. This is live selling momentum on the hourly, which contradicts any quick recovery thesis.
The 1H Bollinger Bands place current price between the midline at $63,162 and the lower band at $62,101, suggesting $BTC is drifting toward the lower end of its hourly range. The 1H pivot point at $62,762 is nearly identical to current price, with R1 at $62,841 and S1 at $62,660 separated by less than $200. This tight clustering signals a compression point where a directional break is overdue.
15-Minute Frame: A Small Glimmer, Execution Context Only
The 15-minute chart offers the only constructive signal across all examined timeframes. The MACD histogram has turned positive at +21.96, with the line at -108.86 beginning to curl up toward its signal at -130.82. The RSI at 48.99 is practically neutral. Price at $62,740 has edged just above the 15M EMA20 at $62,706 — the first EMA crossover above price in any timeframe. This matters strictly as execution context: if a trader wanted to enter a long, the 15M structure provides just enough green light. However, without 1H confirmation, this micro-momentum can be extinguished in a single hourly candle.
The Bullish Case and What Kills It
For bulls to gain control, Bitcoin must reclaim and hold the daily pivot at $63,086, then push through the 1H EMA cluster between $63,099 and $63,491. A close above that zone on the hourly, ideally with RSI recovering above 45, would validate a short-term recovery toward the daily upper Bollinger Band at $65,386 and the R1 resistance at $64,072. The daily MACD histogram improvement gives this scenario a foundation: if selling momentum is truly decelerating, the next catalyst could trigger a sharper squeeze.
Strategy’s $3 billion reserve raise represents the kind of corporate action that, if followed by more institutional accumulation announcements, could reignite demand-side pressure. That said, what invalidates the bull case immediately is a break below the 1H lower Bollinger Band at $62,101. That would expose the daily S1 at $61,748 and the daily Bollinger midline at $61,892. Losing that zone on a closing basis would likely accelerate selling toward the lower daily band at $58,397 — a roughly $4,300 drop from current levels, well within the daily ATR range over a few sessions.
The Bearish Case and What Changes It
Bears hold the structural advantage with every meaningful EMA overhead and the 1H MACD in negative crossover, though the daily MACD histogram warns against complacency. The daily regime is bearish, every meaningful EMA sits overhead, and the macro backdrop — oil-driven inflation fears coupled with a Fear & Greed Index at 28 — does not support risk appetite. Bitcoin dominance at 56.03% suggests altcoins are being abandoned faster, which is typically a late-stage risk-off signal rather than a recovery setup. If $BTC fails to reclaim $63,086 in the next few sessions and the inflation narrative intensifies, a drift toward the $60,000–$61,748 range becomes the path of least resistance.
The bearish scenario breaks down if the macro narrative shifts. Specifically, if inflation concerns ease or a significant accumulation event forces a short squeeze through the overhead EMA cluster, $BTC could flip rapidly. The daily ATR confirms that $2,000-plus daily moves are normal, and a surprise macro catalyst could quickly transition the 1H regime from neutral to bullish. Furthermore, the daily MACD histogram is telling bears not to get complacent: deceleration in downside momentum tends to precede the sharpest covering rallies.
Positioning and Risk Awareness
Bitcoin sits at a genuine inflection point — not in a dramatic way, but in the quiet, dangerous manner where the next few daily closes carry disproportionate weight. The compression around the $62,660–$62,841 pivot range on the hourly is unsustainable; something has to give. With daily ATR near $1,937 and the market in fear, volatility demands respect regardless of directional bias.
The interplay between Strategy’s mixed signals — buying at scale while also executing its largest-ever $BTC sale of $216 million — reflects the broader uncertainty in institutional positioning. That ambiguity is priced into the current range, and breaking out will require a clearer narrative, not just technical pressure-release. In this context, Bitcoin at a crossroads: bears hold the daily while bulls fight for footing near $62,700 is not merely a description but a warning that both a $65,000 recovery and a $60,000 flush are live scenarios within the current daily ATR framework. Neither certainty nor panic is warranted here — what is warranted is discipline.
FAQ
What is driving Bitcoin’s current price weakness?
An oil-price spike is stoking fresh inflation fears, turning the macro environment hostile for risk assets like Bitcoin. The Fear & Greed Index has slumped to 28, deep into fear territory, while the broader crypto market cap sits at approximately $2.24 trillion, down nearly 1.9% over the last 24 hours according to CoinGecko.
What are the key levels to watch for Bitcoin?
The daily pivot at $63,086 is the immediate level to reclaim for any bullish recovery. Resistance sits at $64,072 and the daily upper Bollinger Band at $65,386. On the downside, losing $62,101 would expose the daily S1 at $61,748, with the lower Bollinger Band at $58,397 as the next major support.
Can Bitcoin recover to $65,000 in the near term?
A recovery to $65,000 is possible but requires Bitcoin to first reclaim the daily pivot at $63,086 and break through the 1H EMA cluster between $63,099 and $63,491. The daily MACD histogram turning positive provides a foundation for such a move, but 1H confirmation is still missing.
What do Strategy’s recent moves signal for Bitcoin?
Strategy raised its reserve to $3 billion through a stock sale — a bullish signal for institutional conviction — but also executed its largest-ever Bitcoin sale, shedding $216 million in $BTC, as reported by Fortune last week. These mixed signals create ambiguity that the market cannot easily interpret as a directional bet.
Disclaimer: This article is for informational purposes only and does not constitute financial advice, an investment recommendation, or a solicitation to buy or sell any financial instrument or cryptocurrency. The analysis provided is not indicative of future results. Investing in crypto assets and financial markets carries a high risk of capital loss. Always do your own research (DYOR) and consult a qualified financial advisor before making any decision.
Article produced with the assistance of artificial intelligence and reviewed by the editorial team.