
Just before 9 a.m. Eastern time, bitcoin’s price perched at $91,463 to $91,809 on Nov. 28, 2025, with a market cap of $1.826 trillion and $52.72 billion in 24-hour trading volume—strutting between an intraday range of $90,485 and $91,839. While the price action flexes near resistance, the charts suggest this isn’t just a breather—it’s a potential springboard.
Bitcoin Chart Outlook
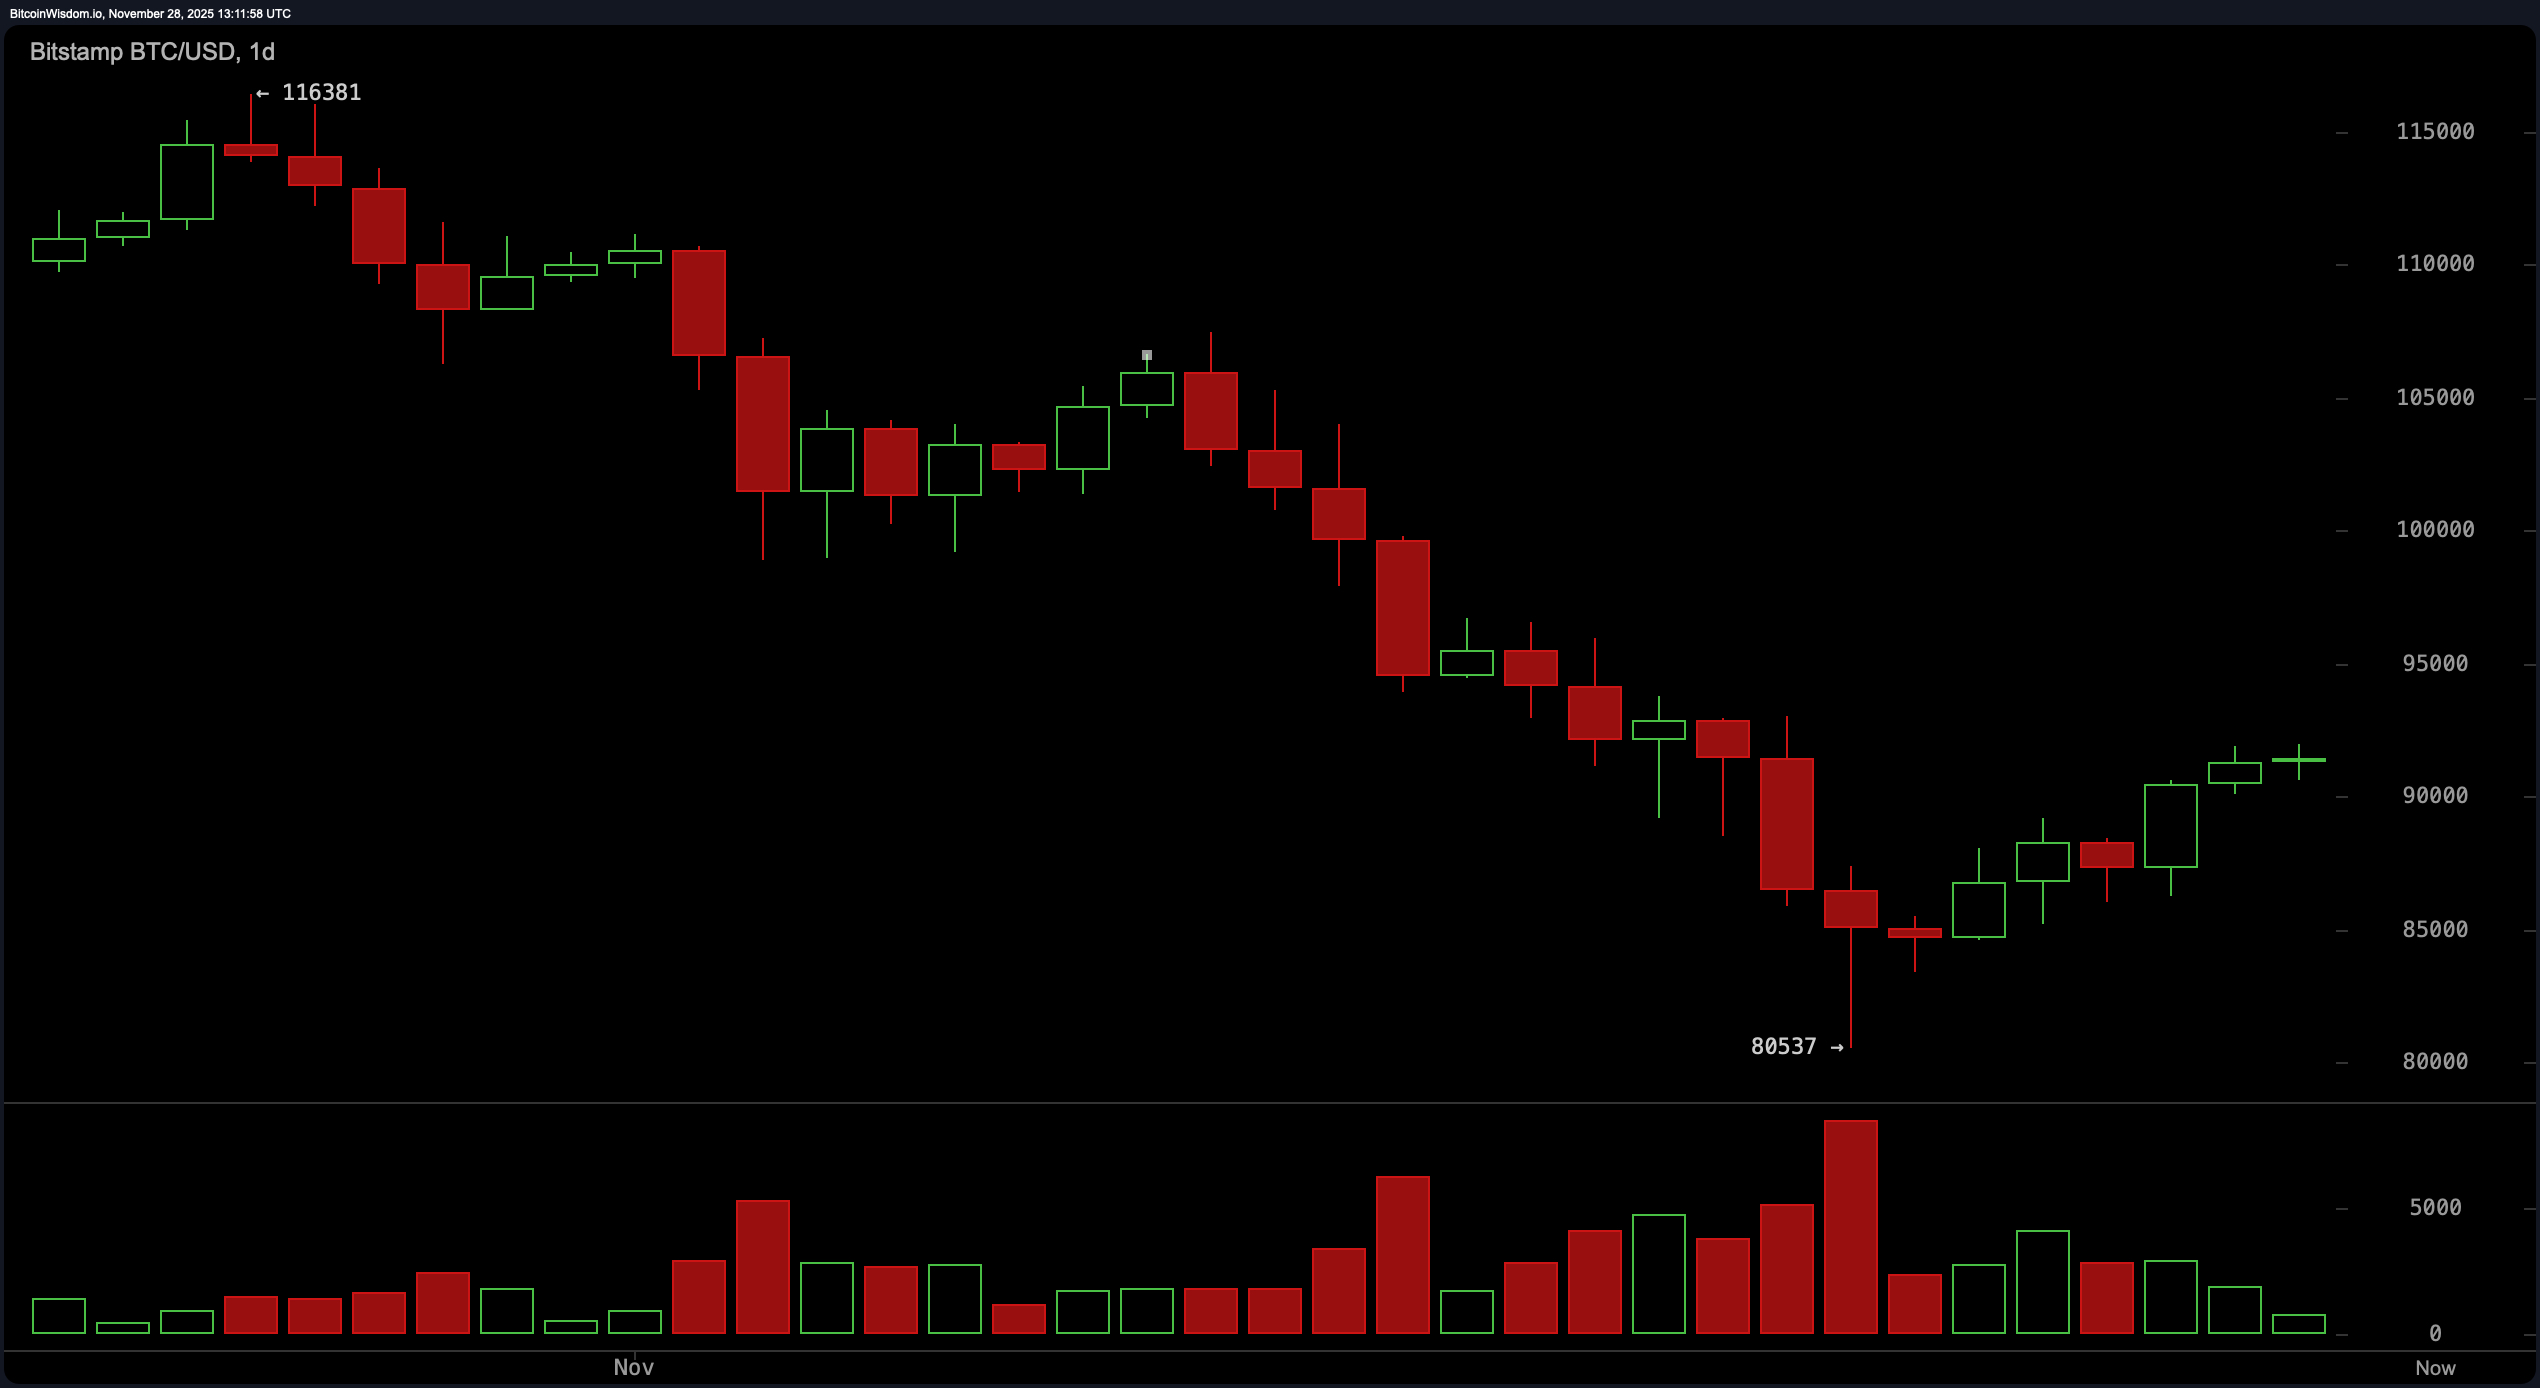
The daily chart paints a phoenix moment. After plunging from the lofty peak of $116,381 to a local low near $80,537, bitcoin reversed with authority. The green candles are stacking like poker chips on the comeback trail, with higher lows and expanding bullish volume confirming that some brave hands started scooping it up around $83,000 to $85,000.
With price now above the $90,000 psychological barrier, the market is eyeing resistance near $95,000 to $97,000 for the next act.
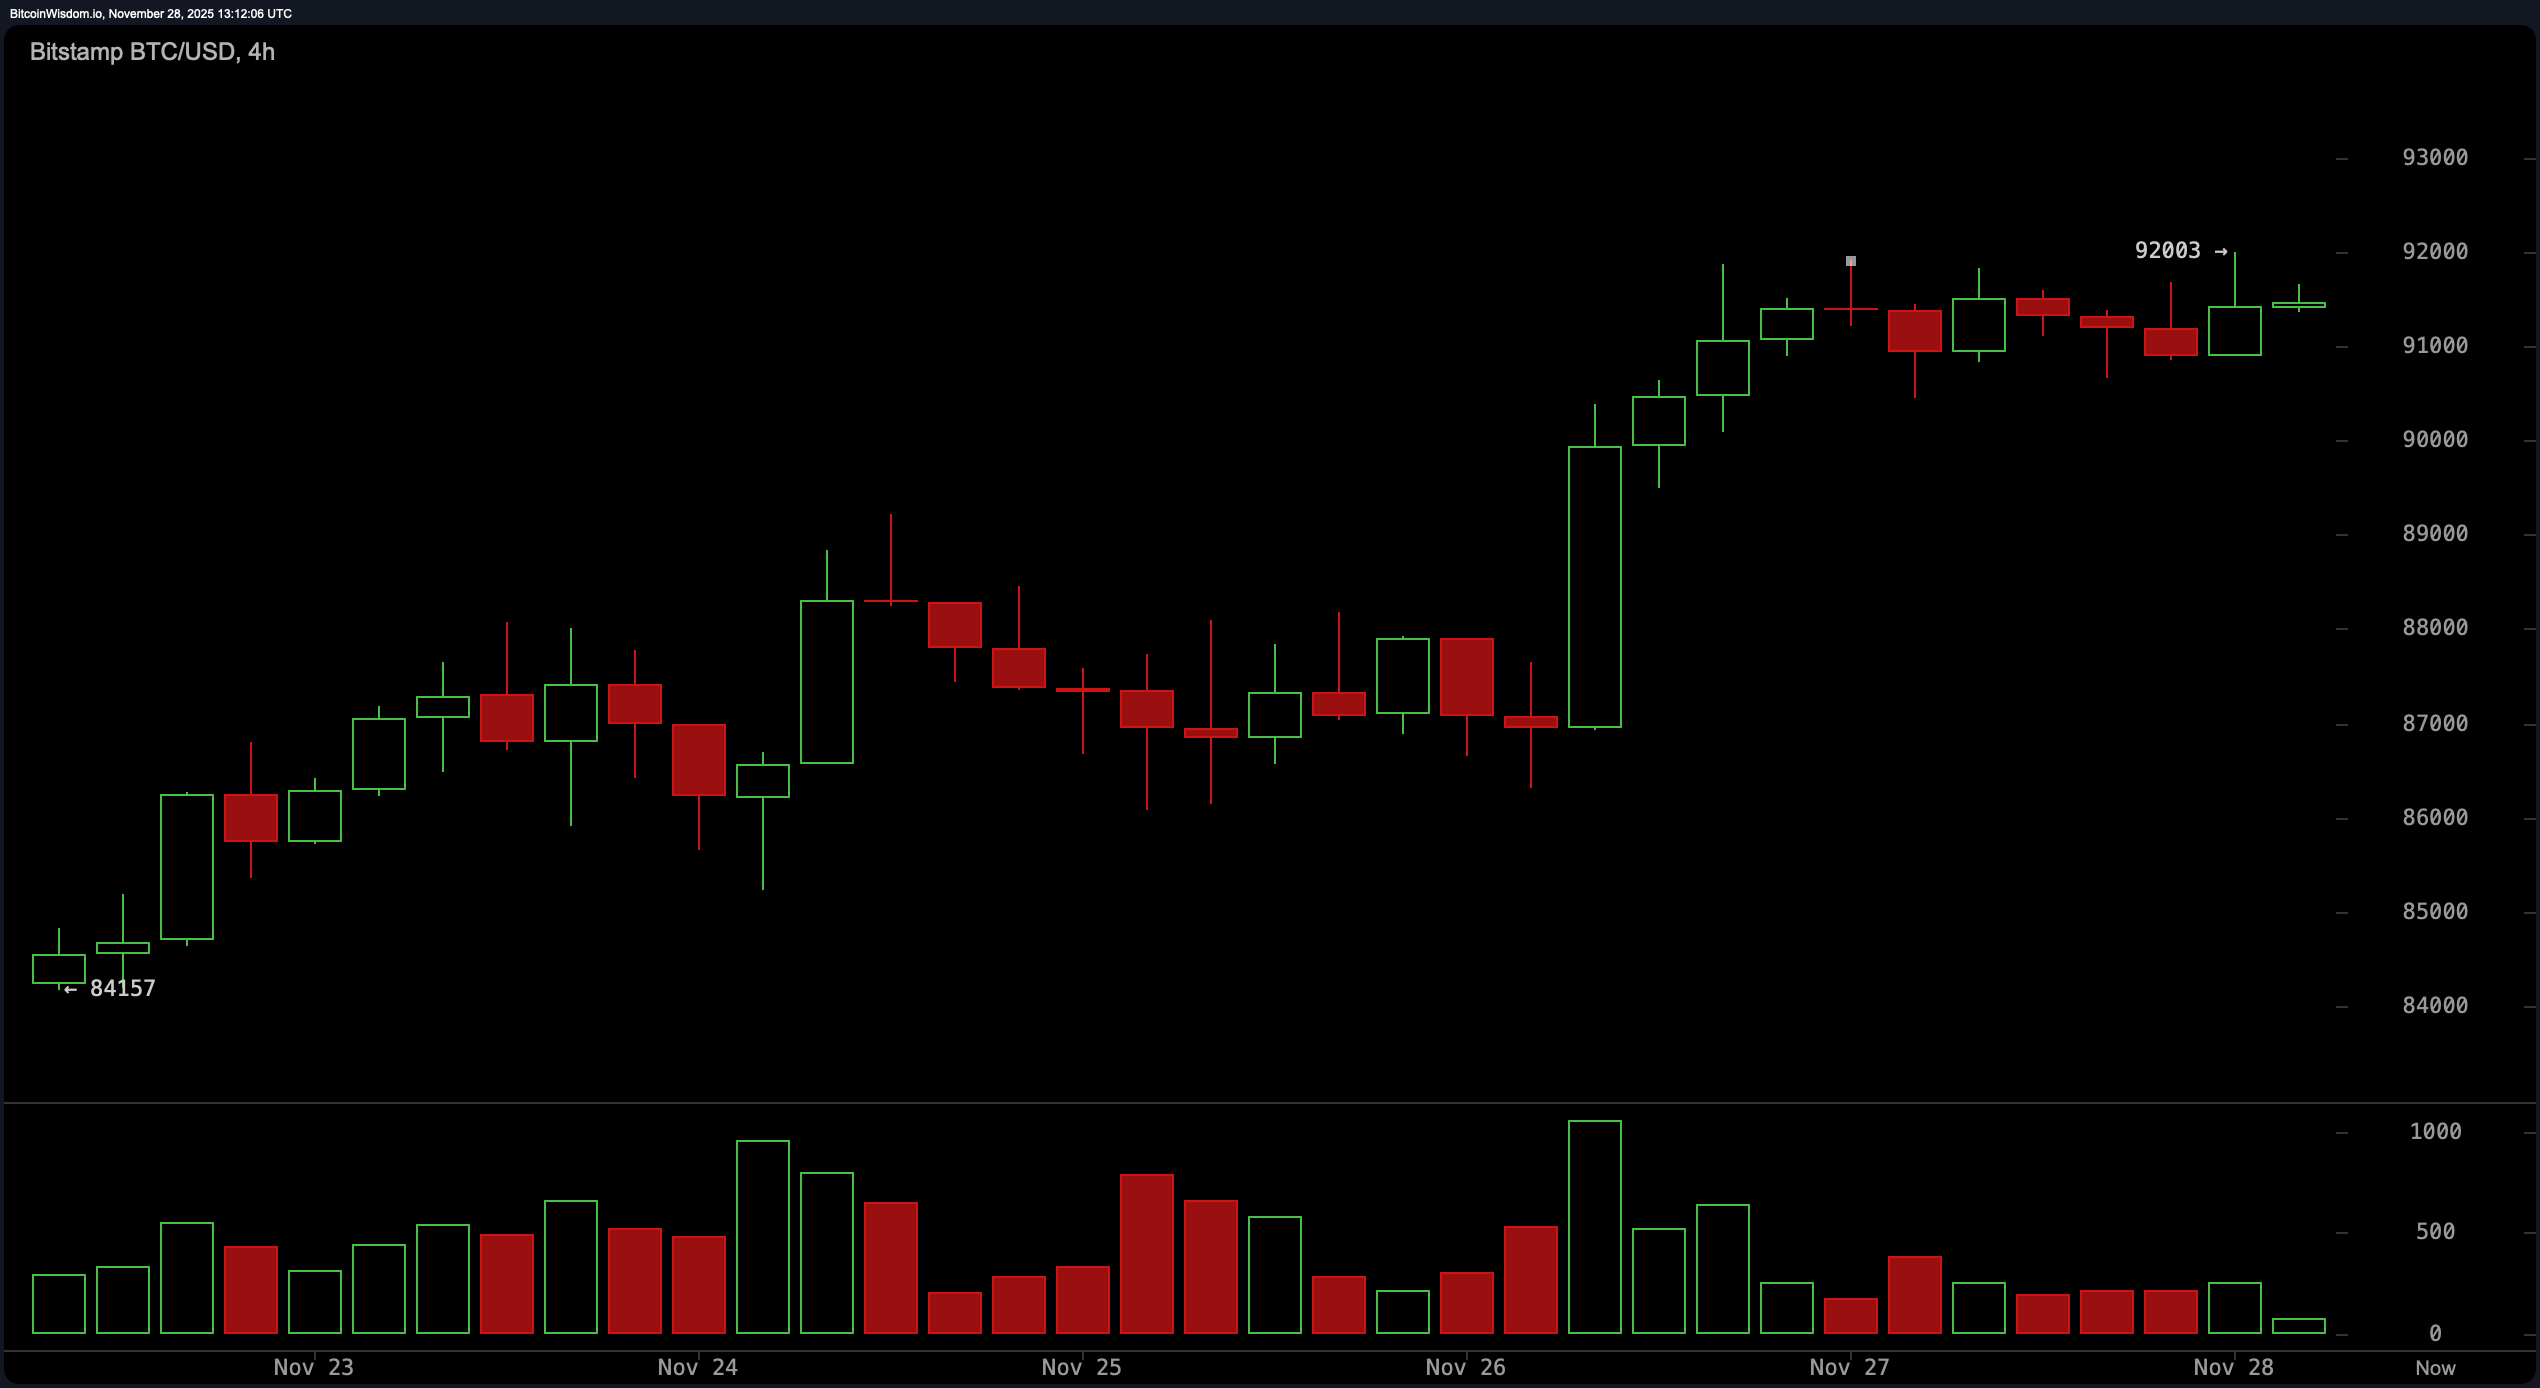
On the 4-hour chart, the story shifts to consolidation wrapped in bullish ambition. Bitcoin rallied from $84,157 to $92,003, and now it’s moving sideways like a tiger stalking its next leap. A well-defined pennant is forming, and if it breaks north of $92,200 with volume to match, the next logical checkpoint sits around $95,000 to $96,000. Until then, it’s a watch-and-wait with the trend on its side.
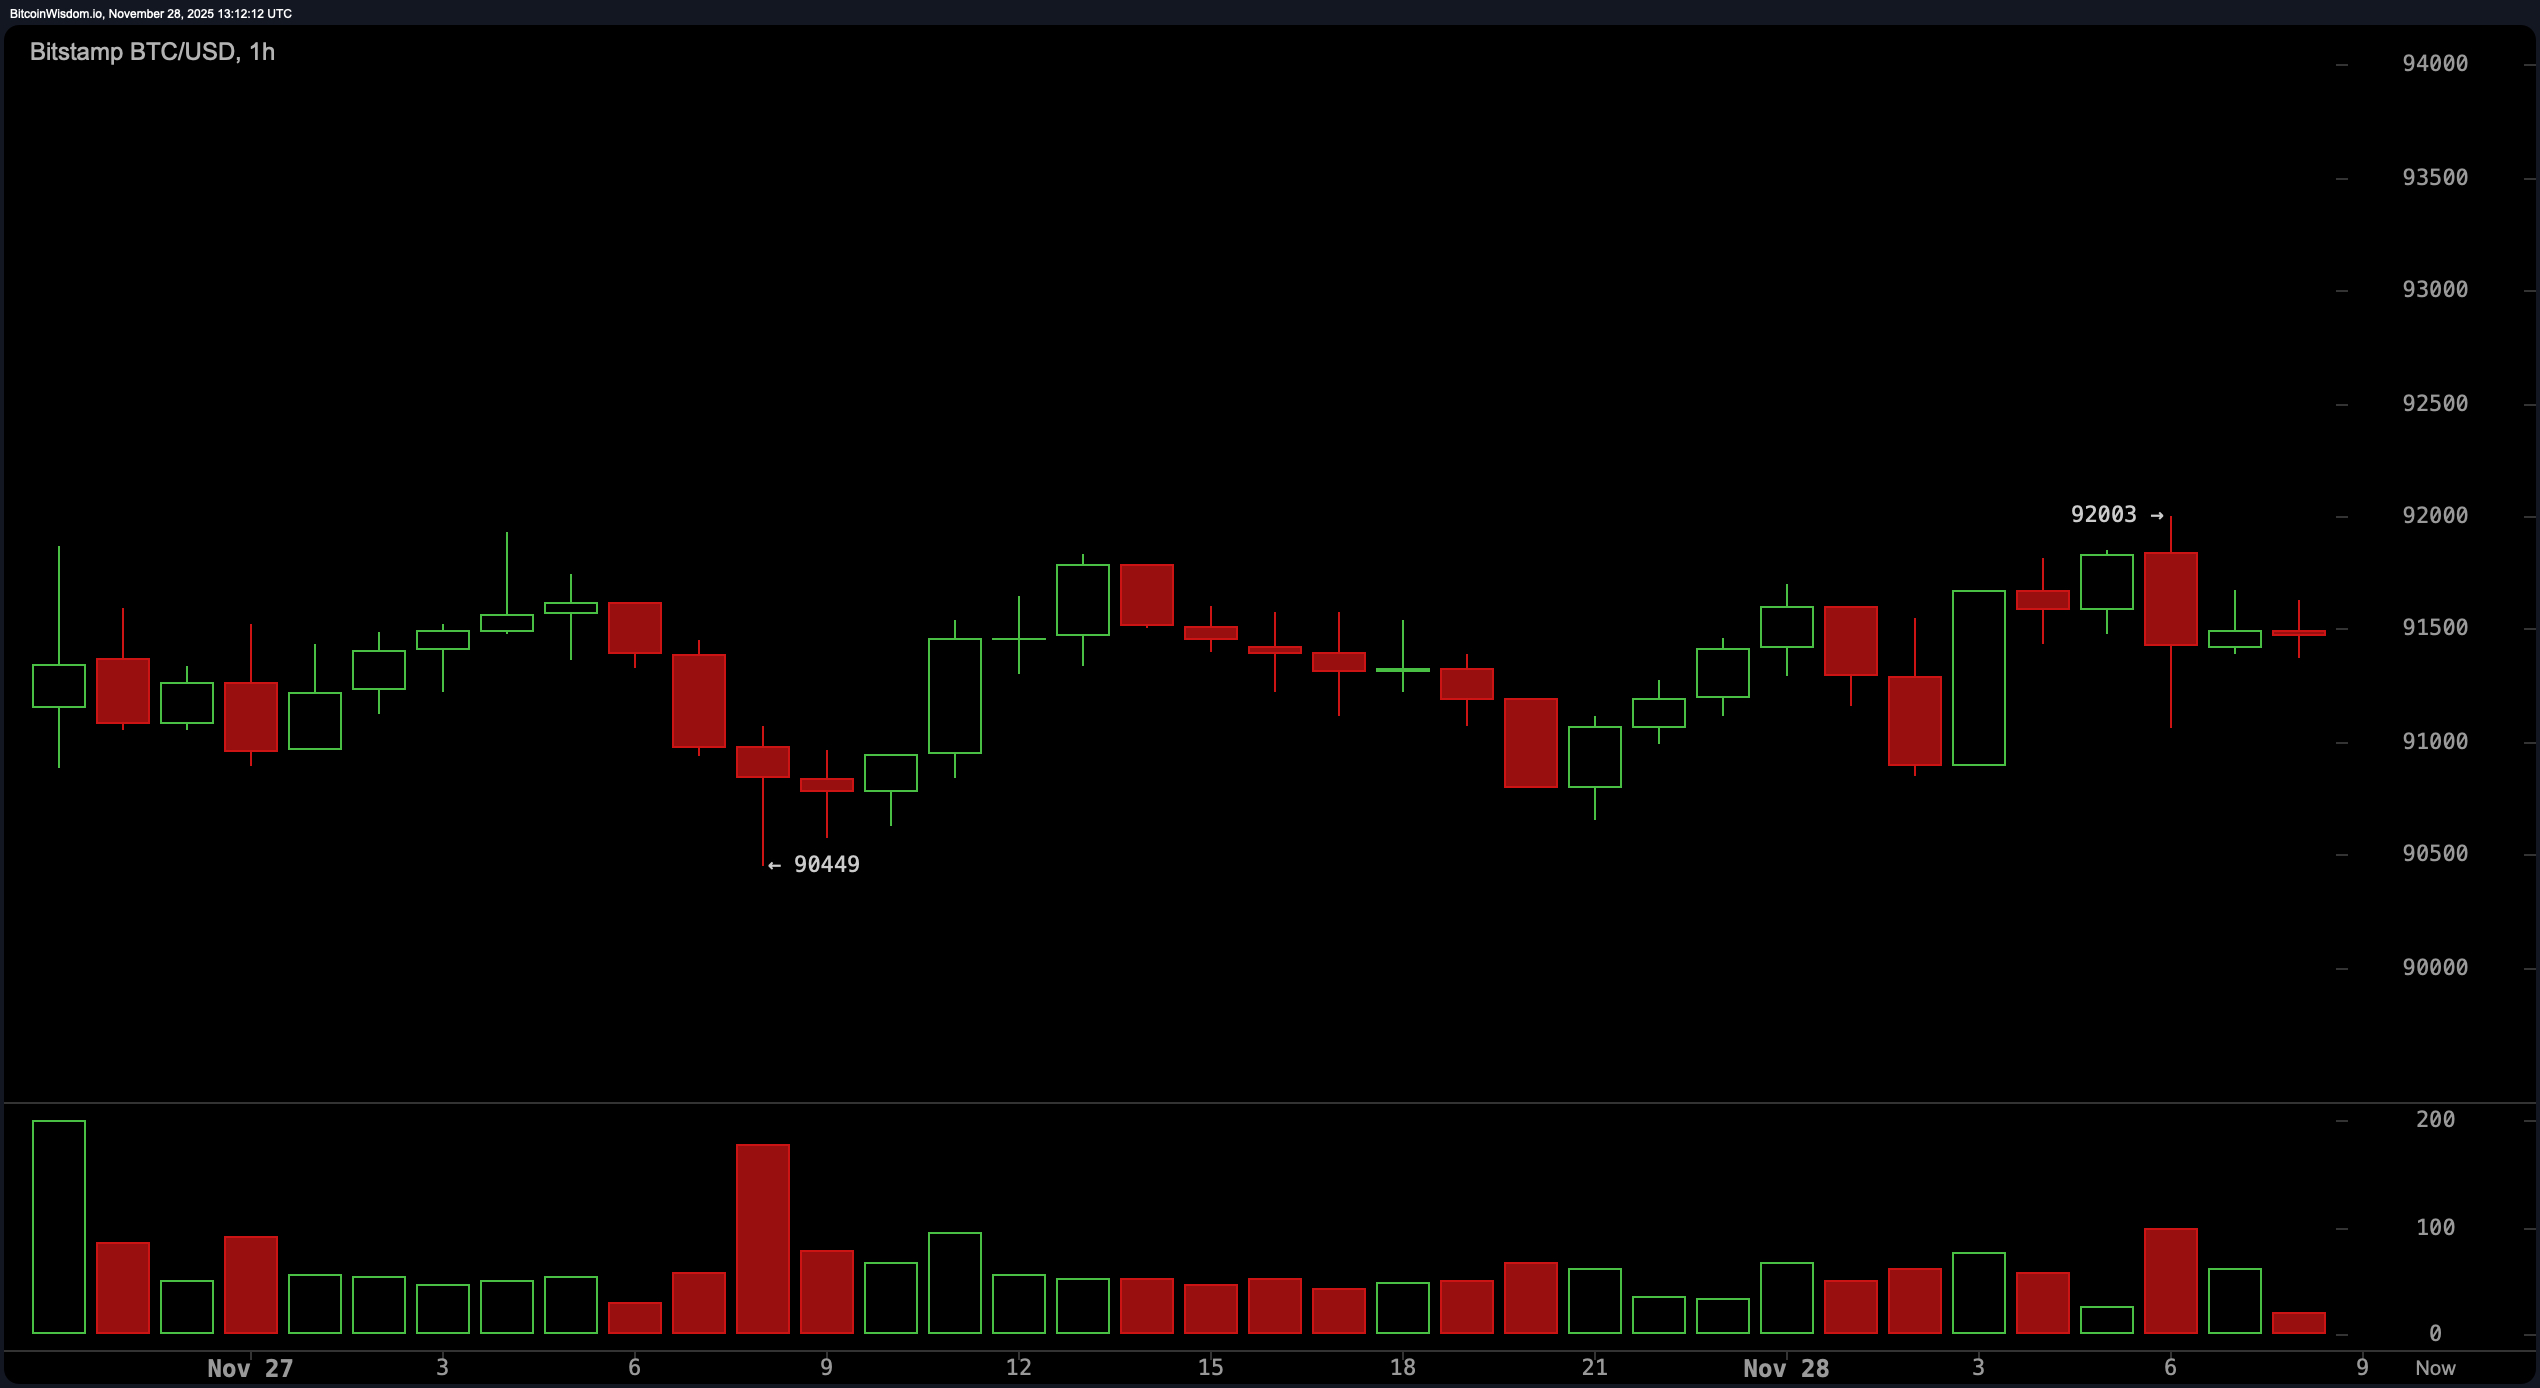
The 1-hour chart throws in a bit of suspense. Price is range-bound between $91,500 and $92,000, repeatedly slamming into a ceiling near $92,003 like it’s testing for weak spots. Low volume and indecision candles—dojis and spinning tops—suggest the market’s torn between conviction and caution. A breakout above $92,100 with volume would be the cue for the next leg, potentially carrying it toward $93,500.
Momentum-wise, oscillators aren’t exactly throwing a party. The relative strength index (RSI) is lounging at 41, the Stochastic oscillator sits neutral at 55, and the commodity channel index (CCI) registers a slightly bearish −25. The average directional index (ADX) comes in at a healthy 43, suggesting the trend has legs—but whether they’re ready to run is still unclear. The Awesome oscillator adds a neutral −10,421 reading, while momentum slips to −1,499, hinting at short-term hesitation. The moving average convergence divergence (MACD), however, plays devil’s advocate with a bullish −4,338 divergence.
Moving averages are a split jury. The 10-period exponential moving average (EMA) and simple moving average (SMA) are sitting pretty below the current price, supporting upward movement. But above that, it’s a red sea: from the 20-period through the 200-period EMAs and SMAs, every reading from $93,223 to $109,866 still flags lower prices, hinting that the broader trend has yet to flip convincingly. That makes this a test of resolve for bitcoin—either it forces a reversal or gets smothered by its own history.
Bull Verdict:
If price breaks decisively above $92,200 with volume that doesn’t hit snooze halfway through the move, bitcoin could stage a swift rally toward the $95,000 to $97,000 zone. The structure is there: higher lows, consolidating momentum, and a breakout-ready flag. As long as it holds above $90,000, the bulls have a technical foothold—and they know it.
Bear Verdict:
Should price fumble and close below $90,000, this bullish setup risks falling flat faster than a meme coin after a celebrity tweet. With most moving averages still stacked above as resistance and momentum indicators refusing to pick a side, a failure to break $92,000 convincingly could send bitcoin drifting back toward prior support near $88,000—or lower if the bears get bold.
FAQ ❓
- What is bitcoin’s price today? Bitcoin is trading at $91,463 as of Nov. 28, 2025.
- Is bitcoin in an uptrend or downtrend now? Bitcoin is recovering from a downtrend and is currently consolidating with bullish potential.
- What are the key resistance levels for bitcoin?Major resistance lies between $92,200 and $97,000.
- What happens if bitcoin drops below $90,000?A close below $90,000 could weaken the current bullish structure.