The bitcoin dominance rate (BTCD) is very close to a crucial resistance level, a breakout above which would indicate that the long-term downward movement has ended.
BTCD has been moving upwards since Jan 16, when it fell to a low of 39.25%. At the time, it had just broken down from the 39.50% horizontal area. However, it has reclaimed the area since and proceeded to reach a high of 42.83% on Feb. 8.
Afterwards, BTCD was rejected by the 0.382 Fib retracement resistance level, which is located at 42.5%. If it is successful in moving above it, there would be strong resistance at 44.5%. This is the 0.618 Fib retracement resistance level and coincides with a descending resistance line.
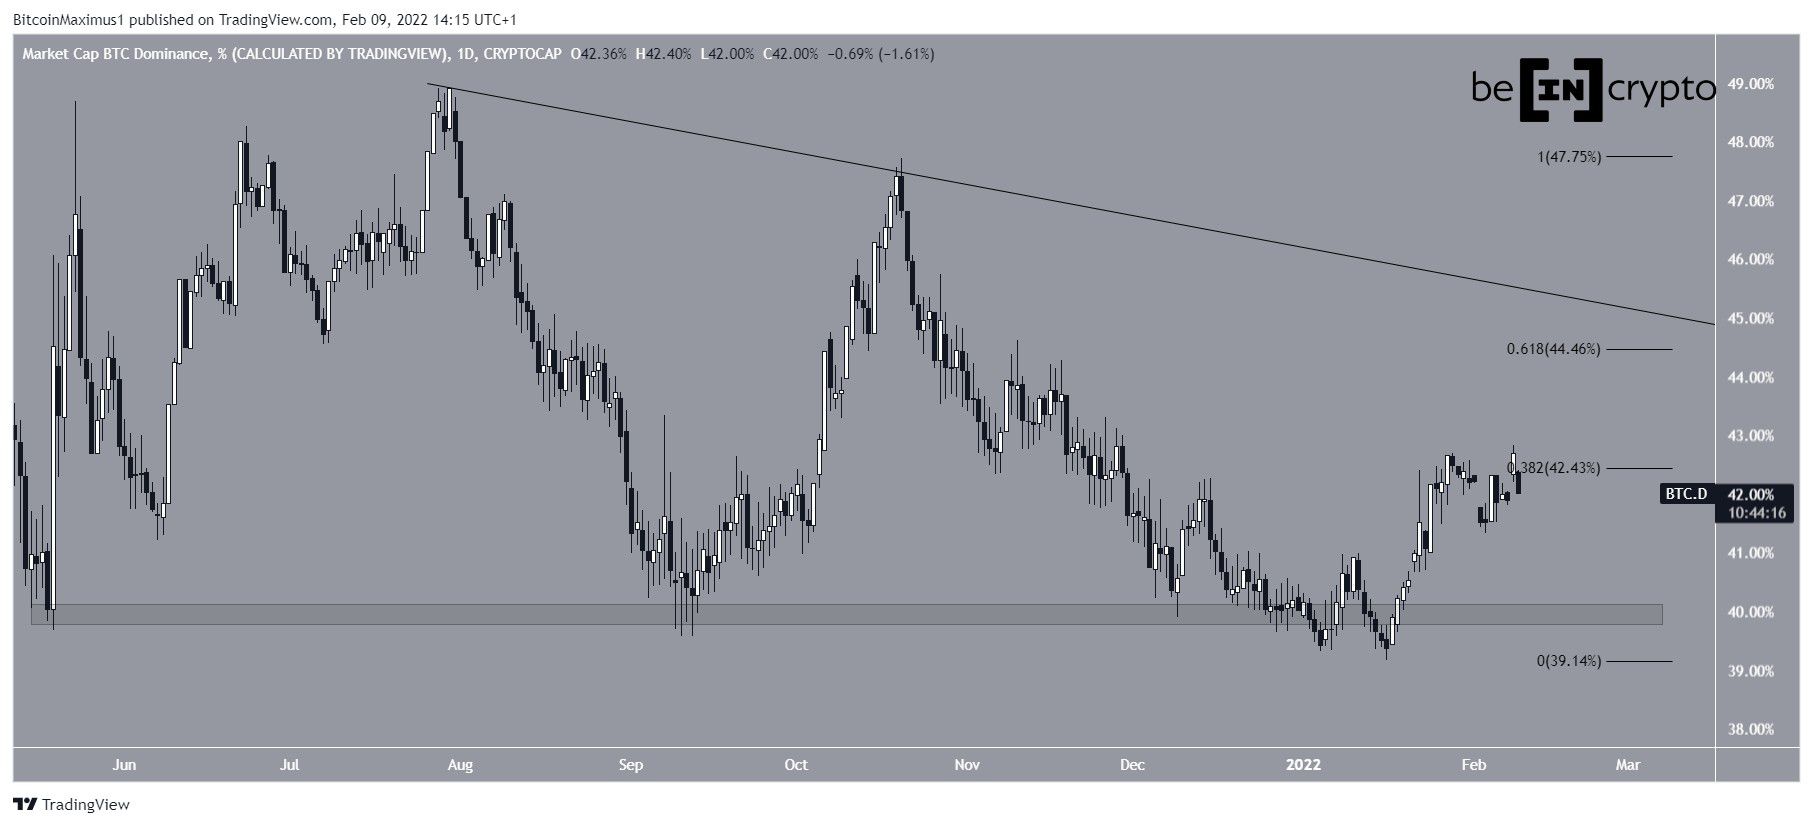
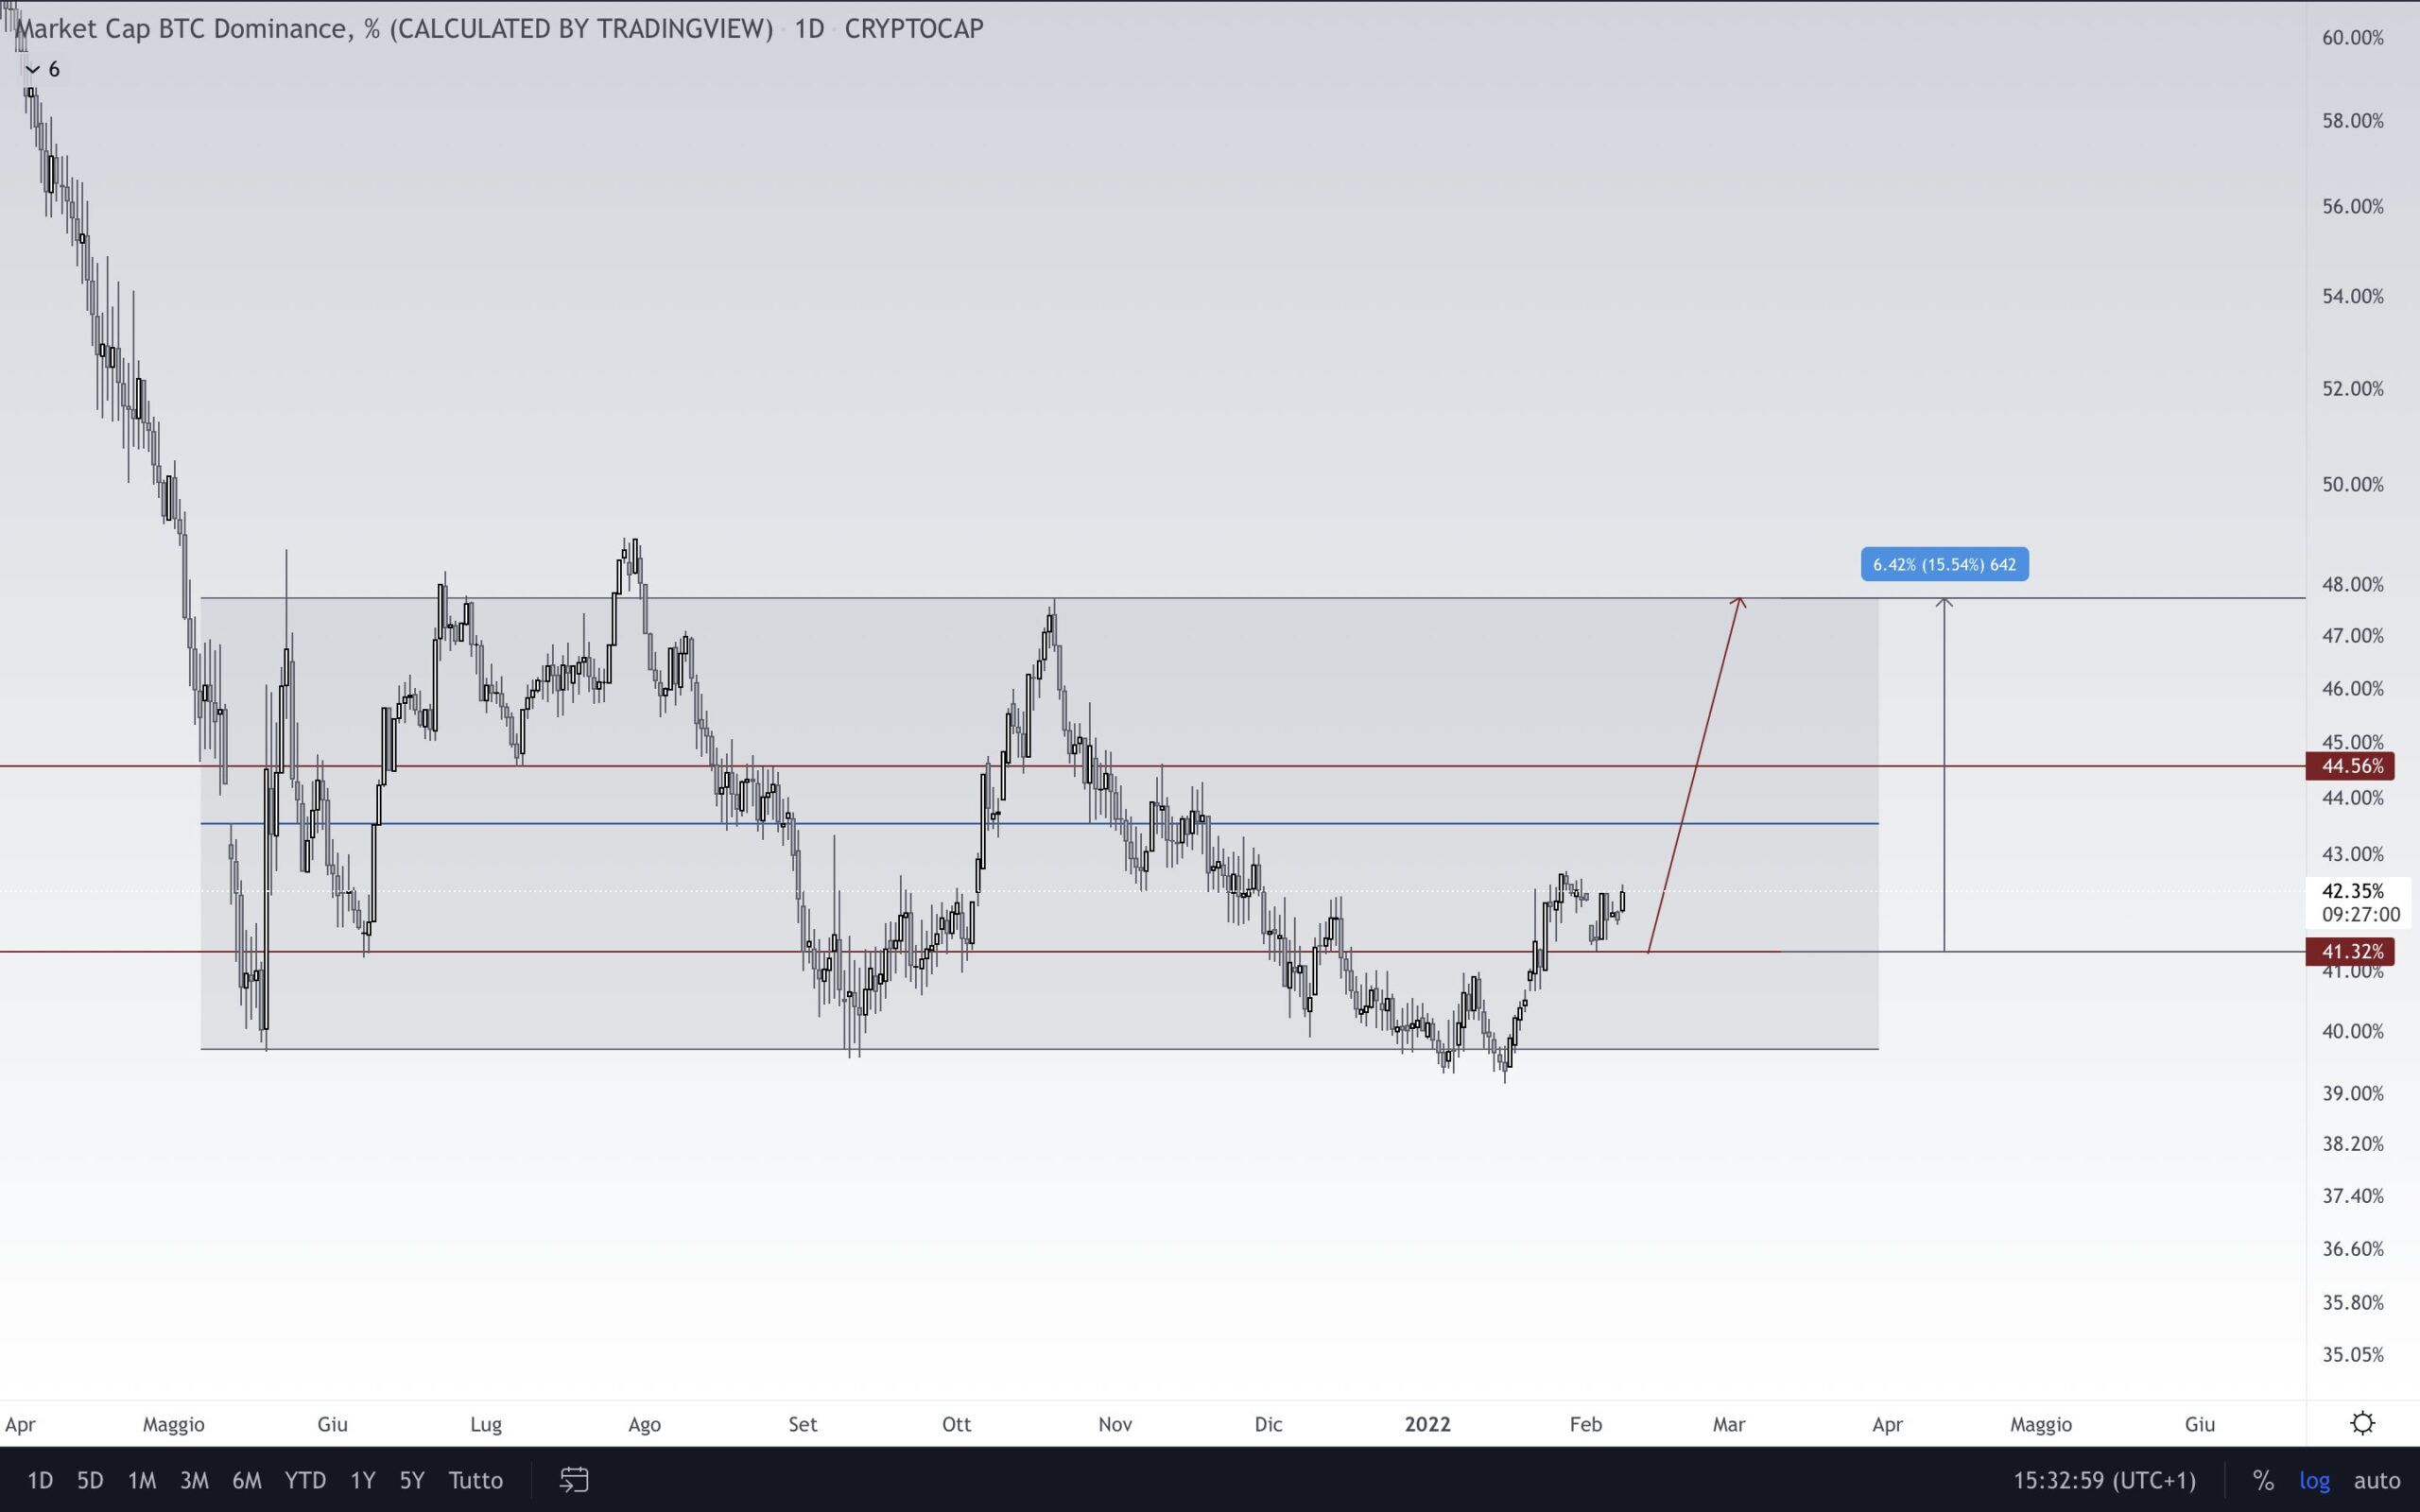
Cryptocurrency trader @eliz883 tweeted a chart of BTCD, stating that an increase towards 48% is likely.
Due to the considerable overhead resistance, a closer look at technical indicators is required in order to determine if BTCD will get there.
Technical indicator readings
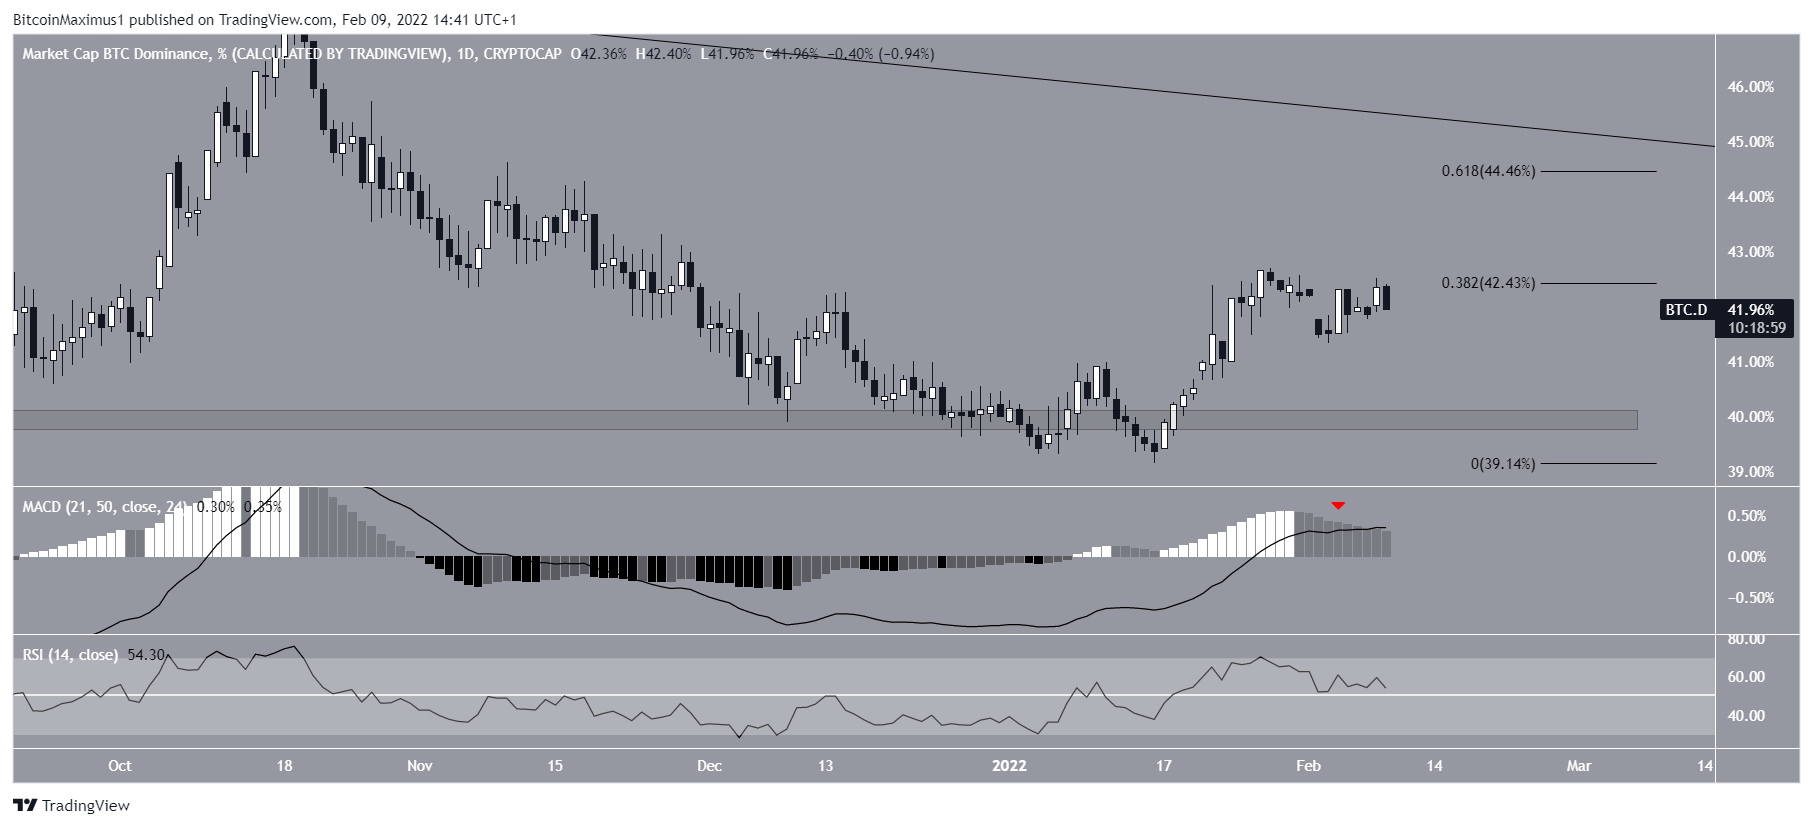
In the daily time-frame, both the MACD and RSI are showing signs of weakness.
The MACD, which is created by a short- and a long-term moving average (MA) is decreasing. This means that the short-term MA is decelerating relative to the long-term one and is a sign of weakness.
Similarly, the RSI, which is a momentum indicator, is also falling. While the fact that it is above 50 is bullish, the decrease is also seen as a sign of weakness.
Long-term BTCD movement
An interesting development is the fact that the increase since Jan 4 resembles a five wave upward movement.
IF correct, then BTCD is in wave four of this increase.
The most likely target for the top of the upward movement would be near 43.4%. The target is found using the 1.61 external Fib retracement on sub-wave four (black) and the 0.618 length of waves 1-3 (white). The target is also close to the previously outlined 44.5% resistance area.
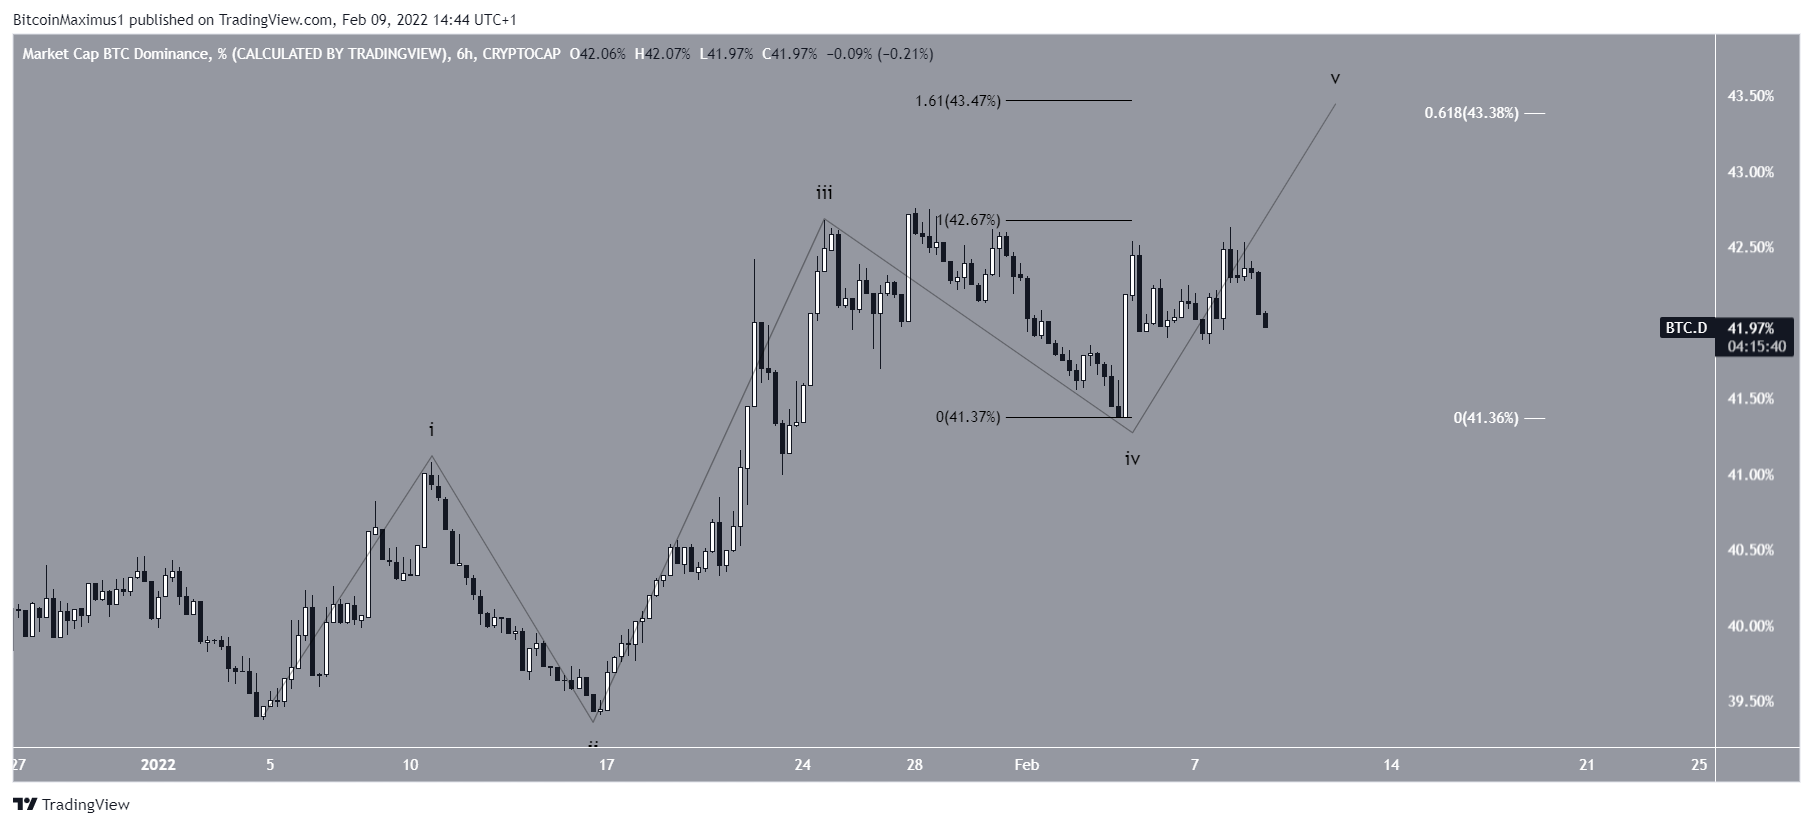
The fact that the increase has taken the shape of a five wave upward movement would suggest that the low is in.
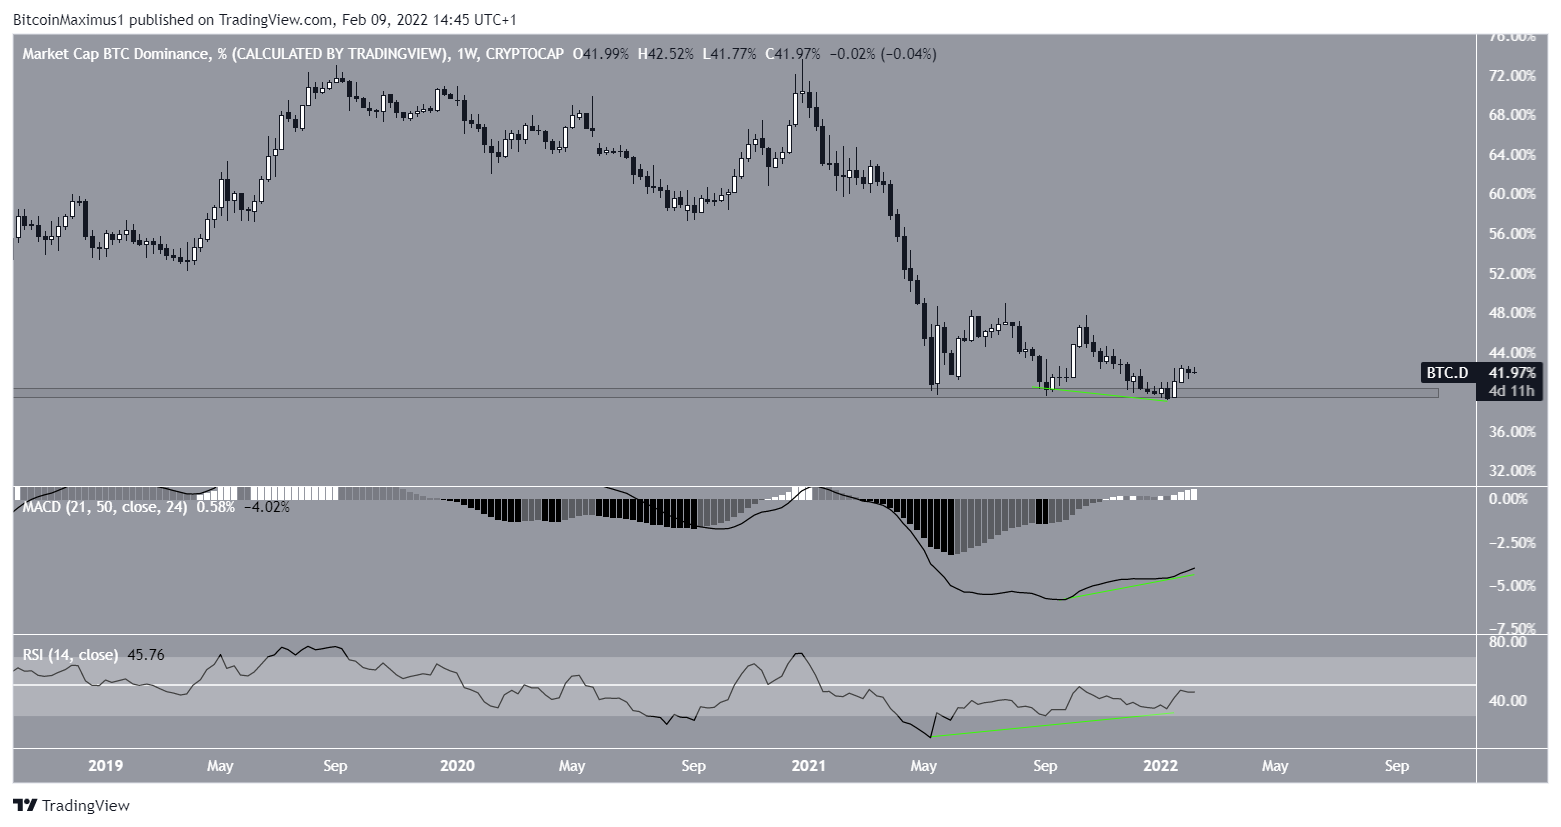
This is supported by readings from the weekly time-frame.
Both the RSI and MACD have generated very significant bullish divergences, an occurrence which is rare in the weekly time-frame.
Therefore, it is possible that the BTCD downward movement that has been ongoing since the beginning of 2021 has come to an end.