In recent weeks, Bitcoin has been locked in a narrow trading range, leaving investors and traders anxious for a breakout. With it hovering below critical resistance levels, experts suggest that the market conditions are ripe for significant price movements. This article explores the current state of Bitcoin and Ethereum, highlighting key levels to watch and potential market trends.
Bitcoin Price Analysis: A Blend of Mixed Signals
1- BTC Price Testing Resistance at $62K
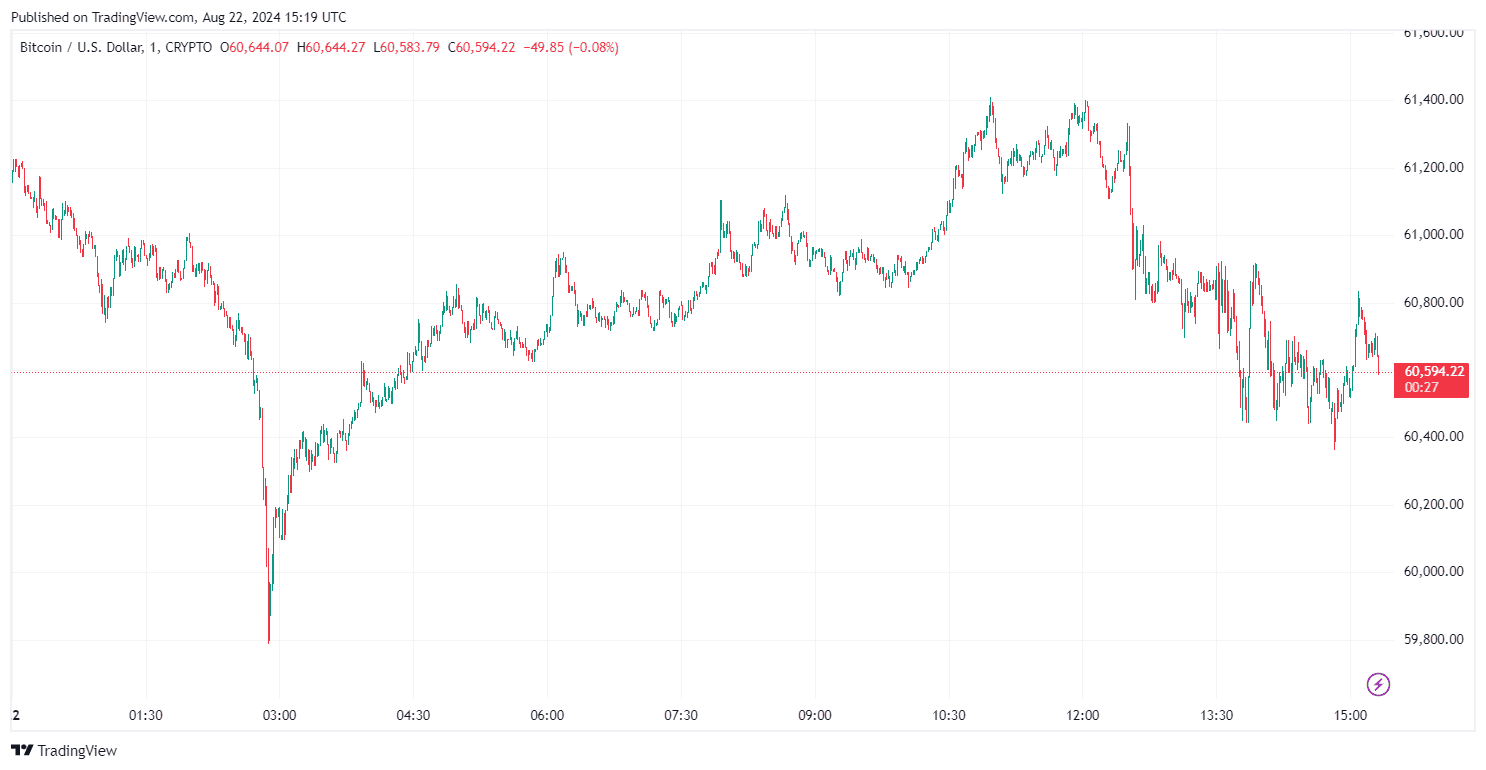
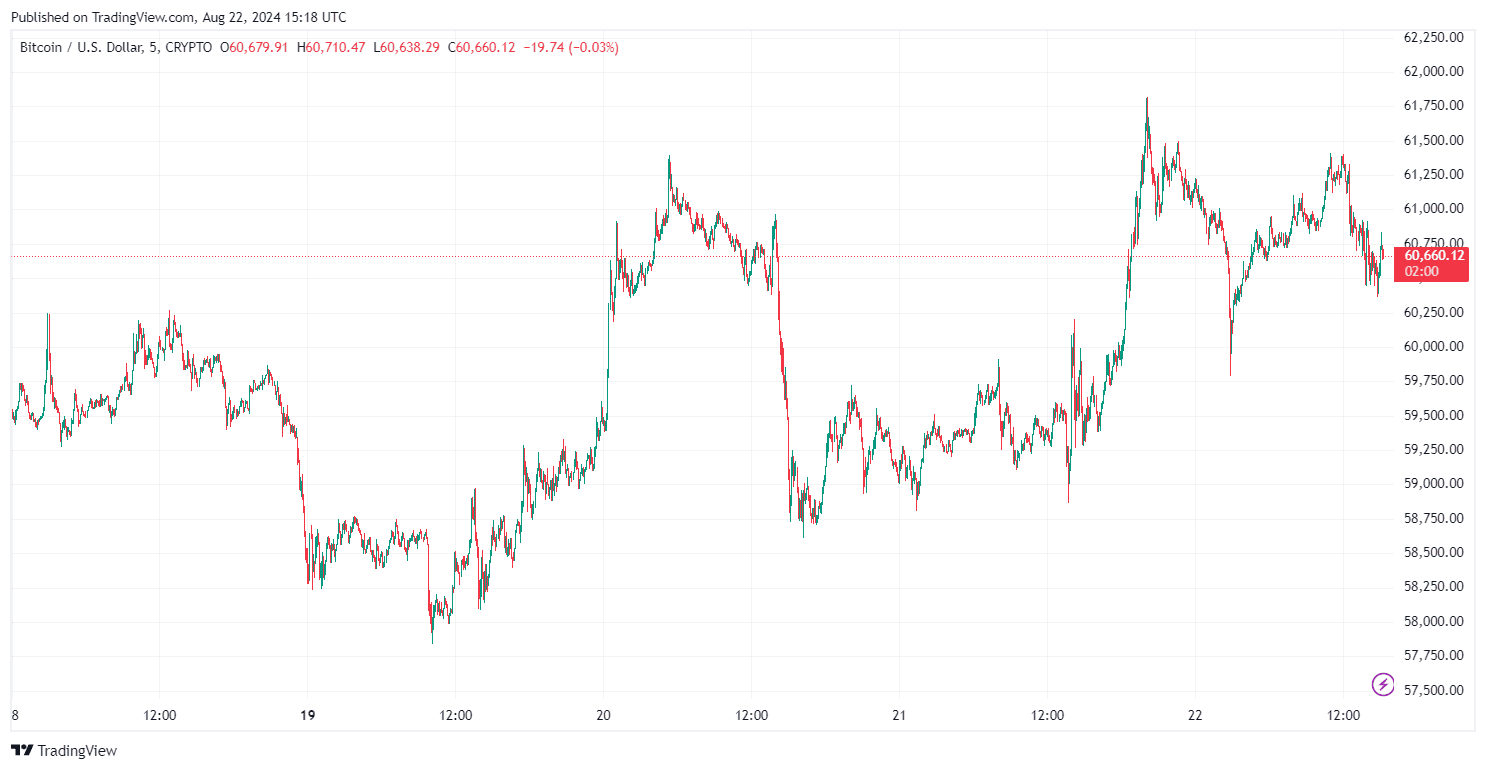
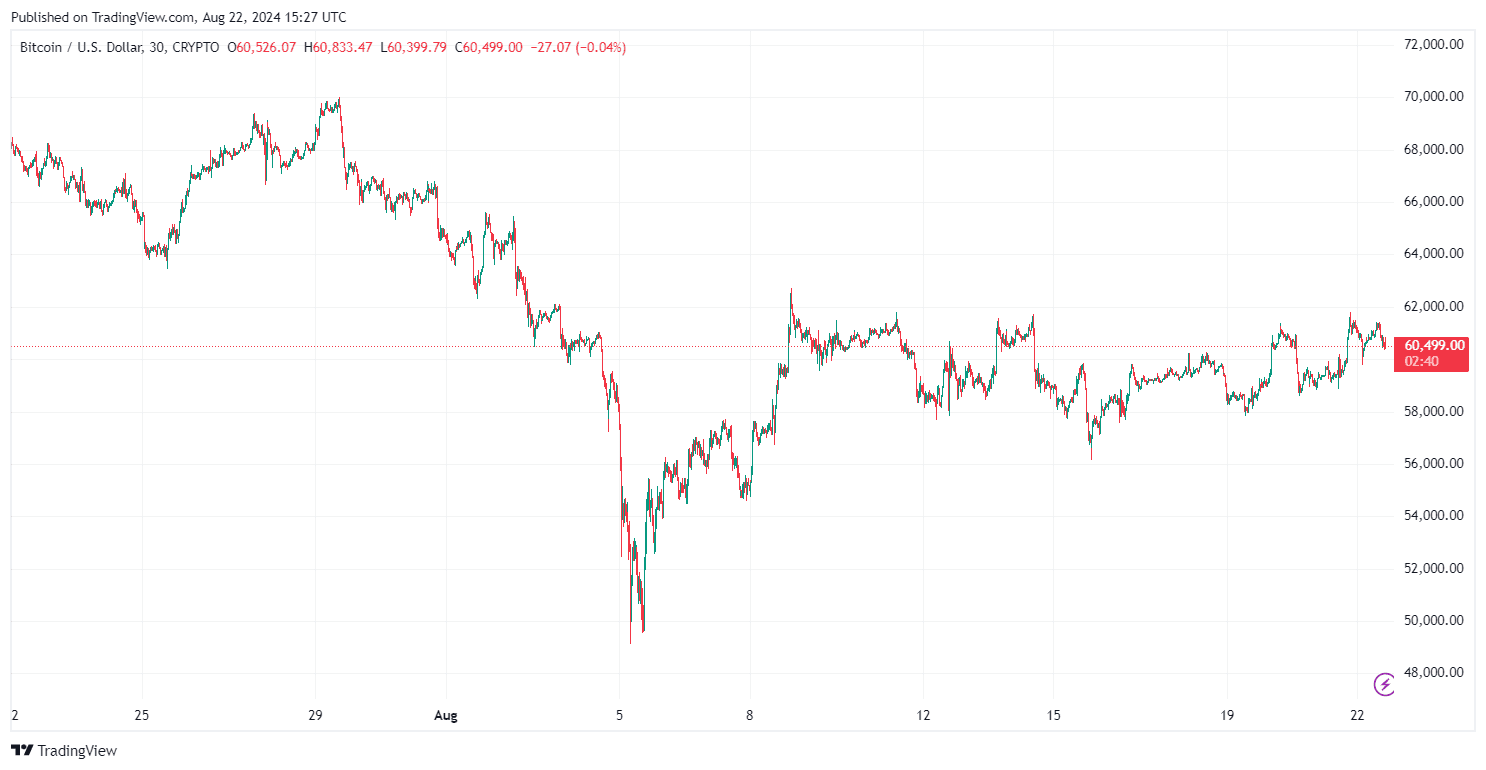
Bitcoin price has been volatile, fluctuating within a tight range as it tests key resistance levels. On August 22, BTC reached $61,000, only to fall back to $59,500 shortly after, shaking out late long positions. Data from TradingView reveals that this price action was influenced by U.S. employment data and the Federal Reserve’s latest meeting minutes.
The $62,000 level has emerged as a crucial resistance point, with increasing ask liquidity turning it into a key target for a potential support flip. Notably, Bitcoin has tested this resistance five times in the past two weeks, leading some traders to believe that a breakthrough is imminent. As one trader has noted, “The more it is tested, the weaker it gets”
Adding to the anticipation is the rising open interest in Bitcoin’s perpetual futures contracts, combined with consistently negative funding rates. A senior analyst at K33 Research, pointed out that these factors could fuel a “short squeeze,” potentially driving prices higher.
2- Bitcoin Megaphone Pattern Signals Potential for Volatility
Some renowned trading experts have identified a “megaphone” or “expanding triangle” pattern on Bitcoin’s weekly and daily charts. This pattern, characterized by wider price swings, often indicates that the market is preparing for a major move, either up or down. Despite this, they caution that no clear trend has emerged yet for Bitcoin, emphasizing that the market could still go either way.
In addressing questions about Bitcoin’s long-term uptrend, many dismissed the significance of diagonal resistance lines and suggested that a break above the $74,000 horizontal resistance would be the most indicative of a sustained rally.
Ethereum Price Analysis: Caution Below $3,050
Ethereum from his end, has mirrored Bitcoin’s recent struggles.
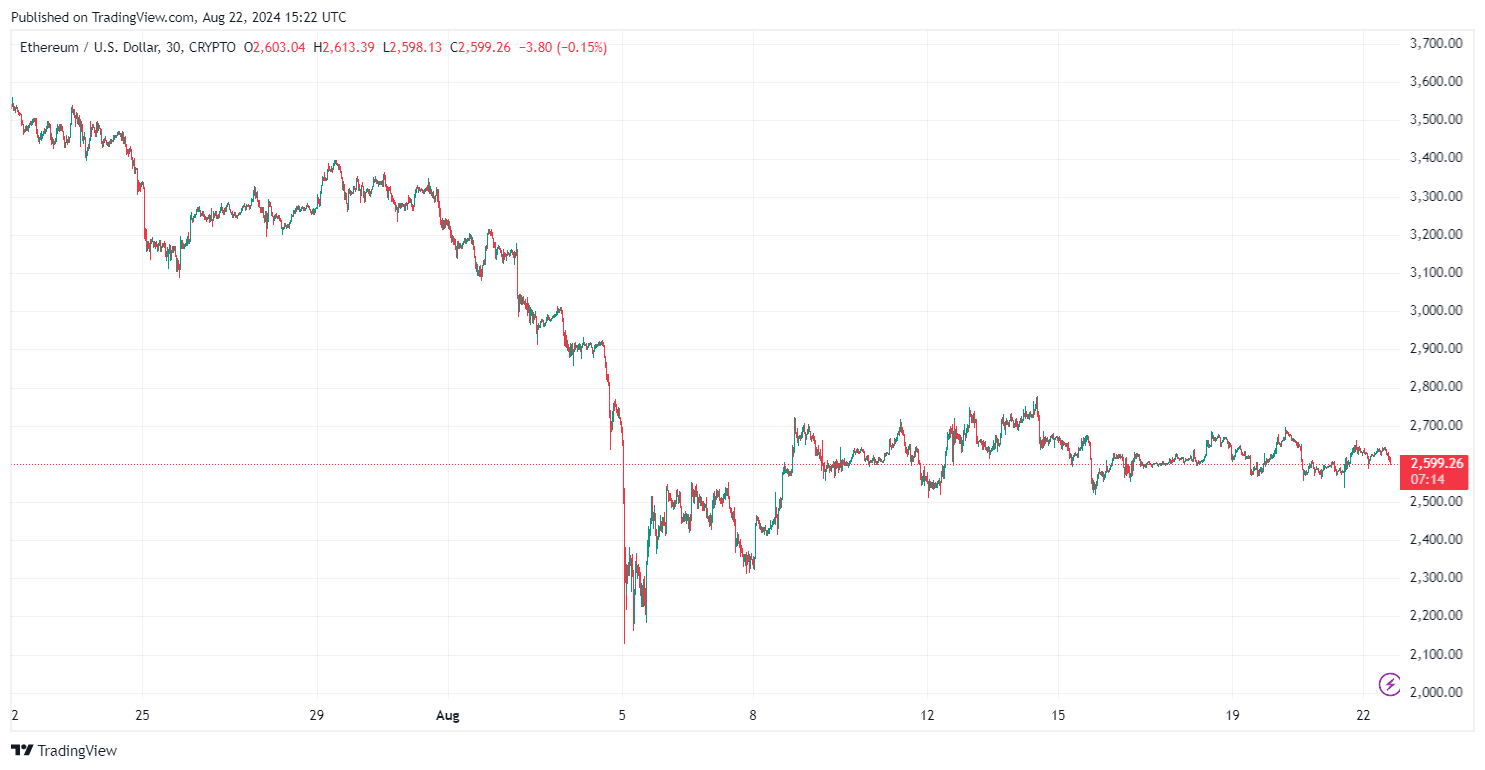
After plunging to $2,197 earlier this month, ETH has been unable to regain the $3,000 mark, with its price hovering around $2,590 and falling back below. Analysts identify $3,050 as a critical resistance level for Ethereum, noting that the altcoin will not exhibit bullish strength until it breaks and closes above this threshold. Until then, Ethereum is likely to remain under bearish pressure, with further declines possible if the resistance holds.
As Bitcoin and Ethereum continue to test critical resistance levels, the market appears poised for a significant move. Traders and investors should closely monitor key levels—$62,000 for Bitcoin and $3,050 for Ethereum—as breakthroughs could signal the beginning of a new bullish trend. However, the potential for further downside remains, underscoring the importance of cautious and informed trading strategies.