Following a modest bullish rebound from the substantial $59K support level, Bitcoin encountered selling pressure, retracing back to the critical 100-day moving average at $61K.
The price action around this pivotal juncture is likely to dictate its next decisive move.
Technical Analysis
By Shayan
The Daily Chart
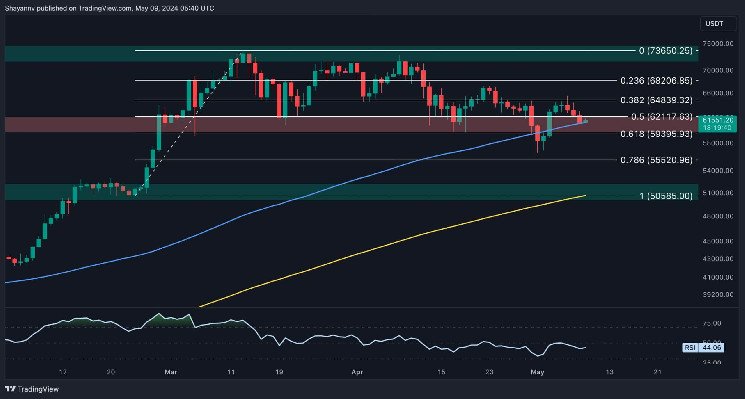
A thorough examination of the daily chart reveals Bitcoin’s extended sideways consolidation phase near the pivotal $60K price range. Recently, the cryptocurrency witnessed a decline after a notable bullish rebound from the $59K threshold, leading to a retracement toward a critical support region.
Bitcoin sellers have been grappling with breaching this significant support area, which encompasses the 100-day MA and the 0.618 ($59,395) Fibonacci level, for several weeks. However, a sudden decline below the critical $59K level could trigger another notable downward movement toward the $56K threshold.
Conversely, this pivotal juncture also holds the potential to halt further downward pressures and provide mid-term support. Thus, the price action around it will be crucial in anticipating Bitcoin’s future movements.
The 4-Hour Chart
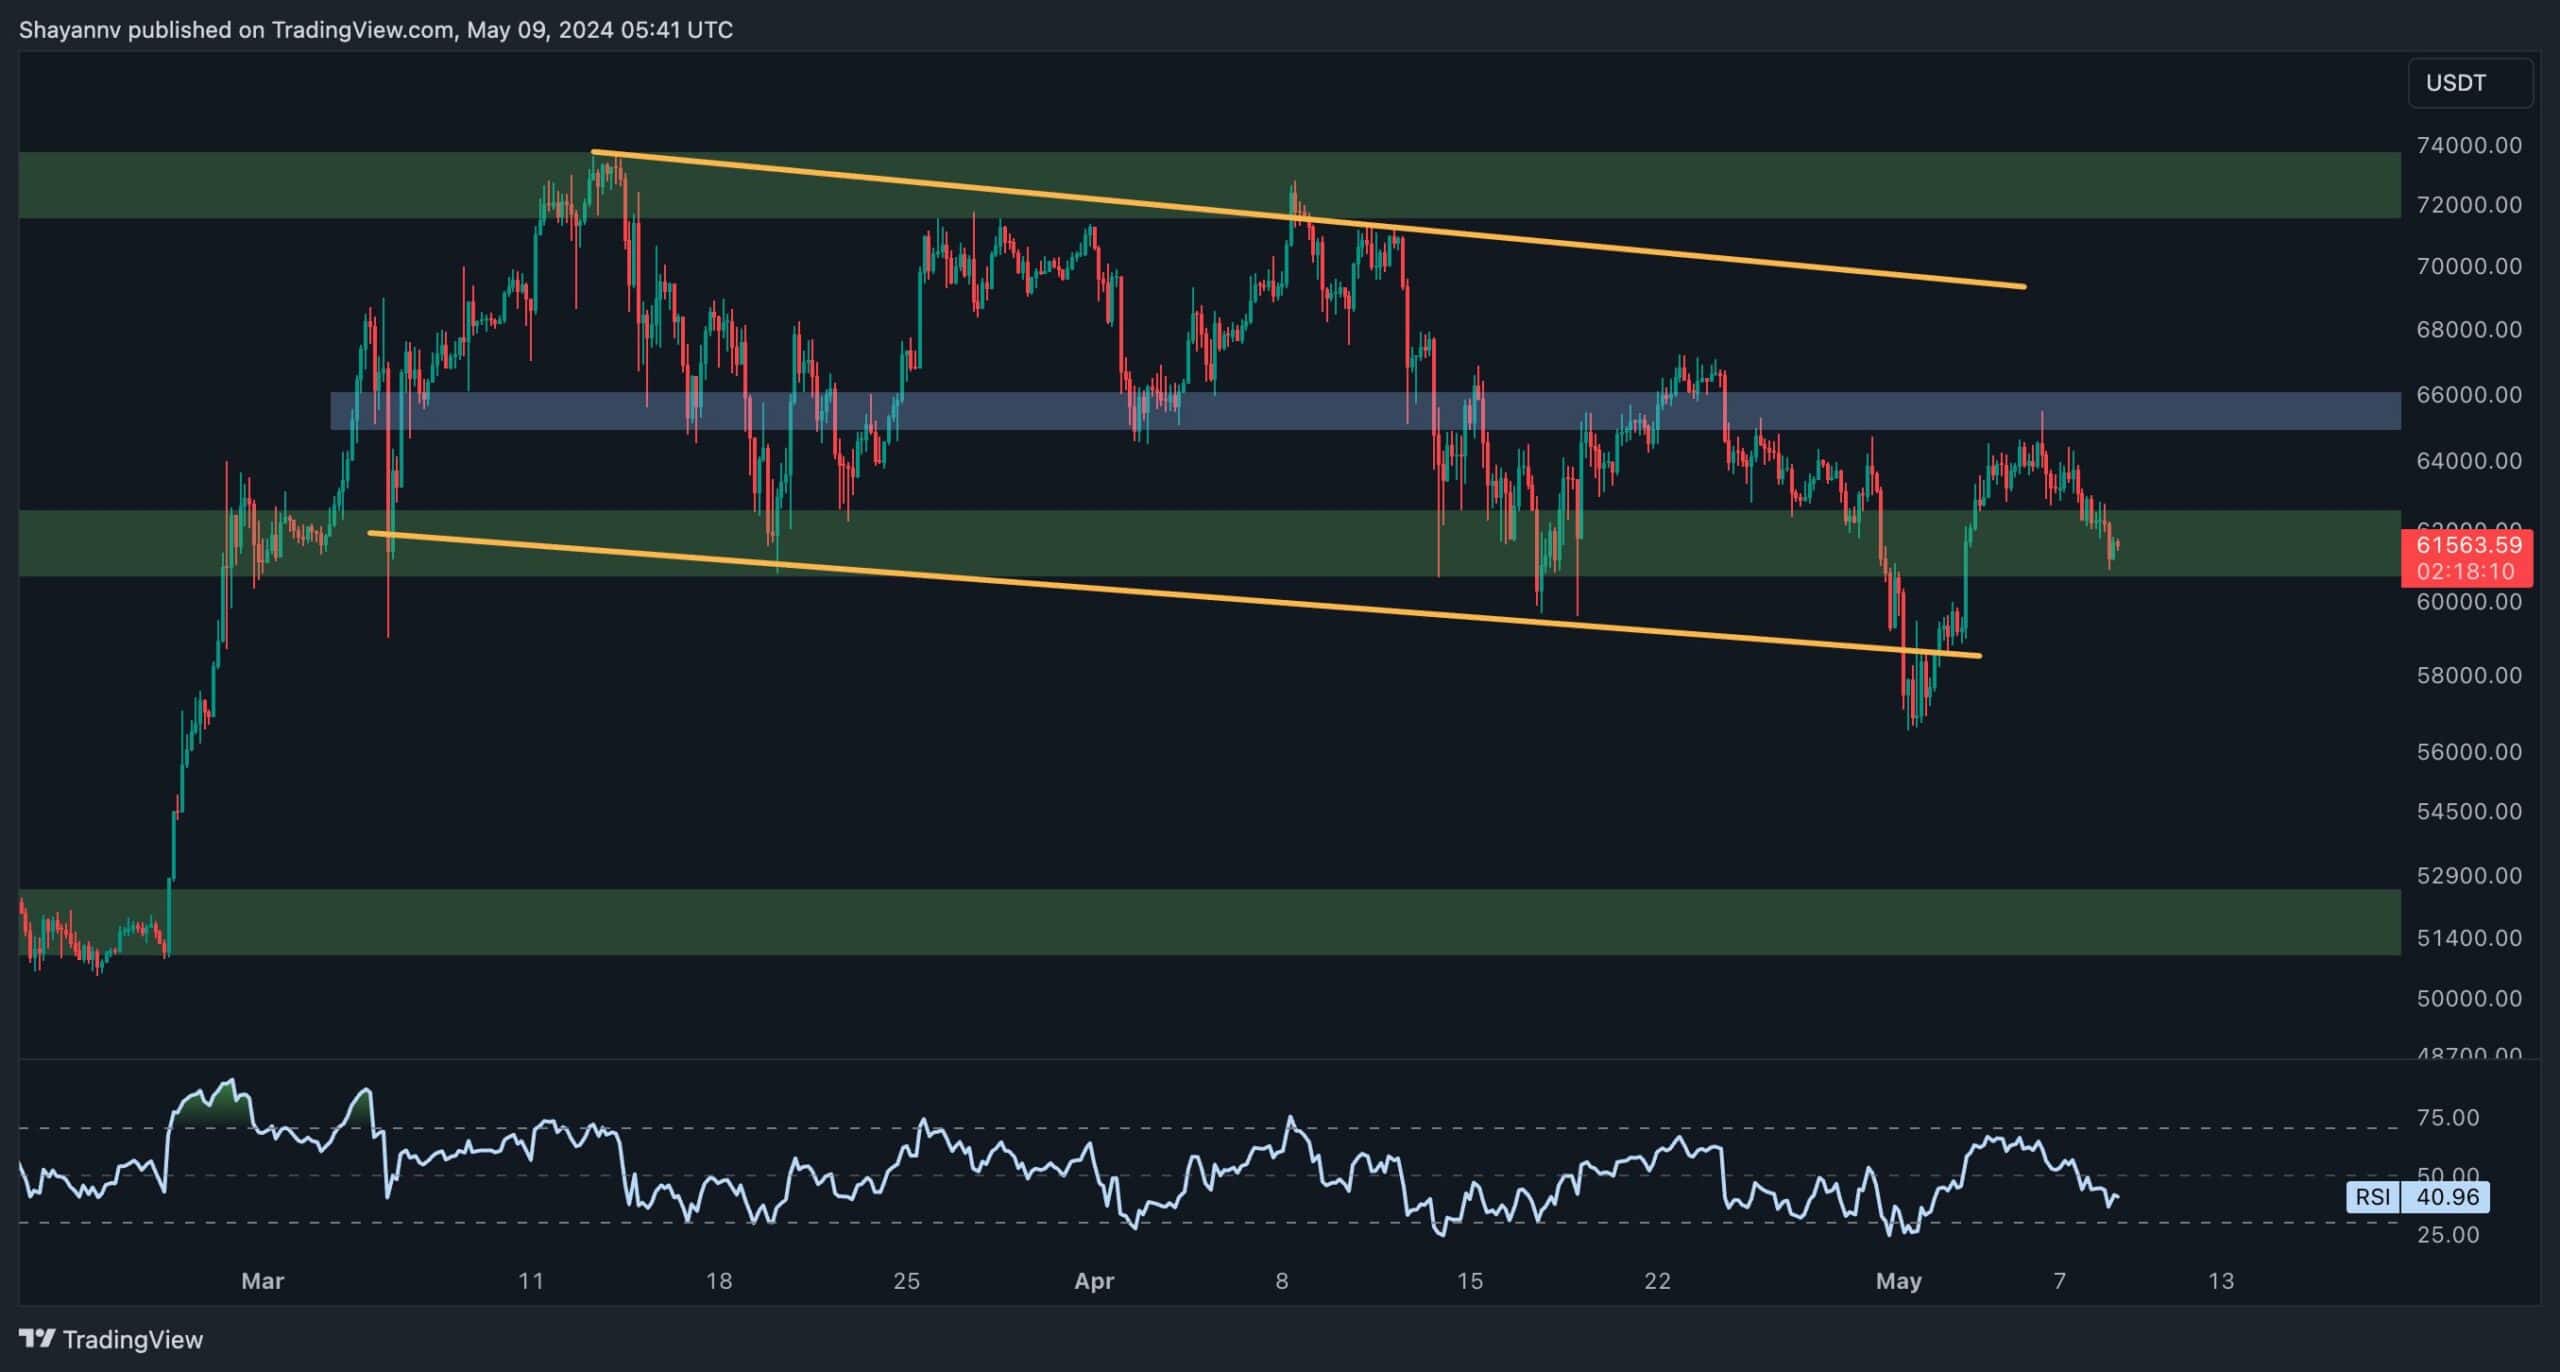
Analysis of the 4-hour chart reveals heightened buying pressure near the critical $58K mark, resulting in a bullish surge toward the $66K threshold. However, increased selling pressure around $66K led to a noticeable downtrend, bringing the price back to the crucial $60K support region.
Presently, sellers are attempting to push the price below the significant $60K support level and the lower boundary of the wedge. If successful, it could signify a more sustained bearish phase, targeting the critical $56K support region.
However, considering the prevailing market sentiment, Bitcoin may continue consolidating or experience slight lower-level declines before gaining sufficient bullish momentum to initiate a fresh upward trend. Traders should closely monitor price movements around these key levels for potential shifts in market sentiment.
On-chain Analysis
By Shayan
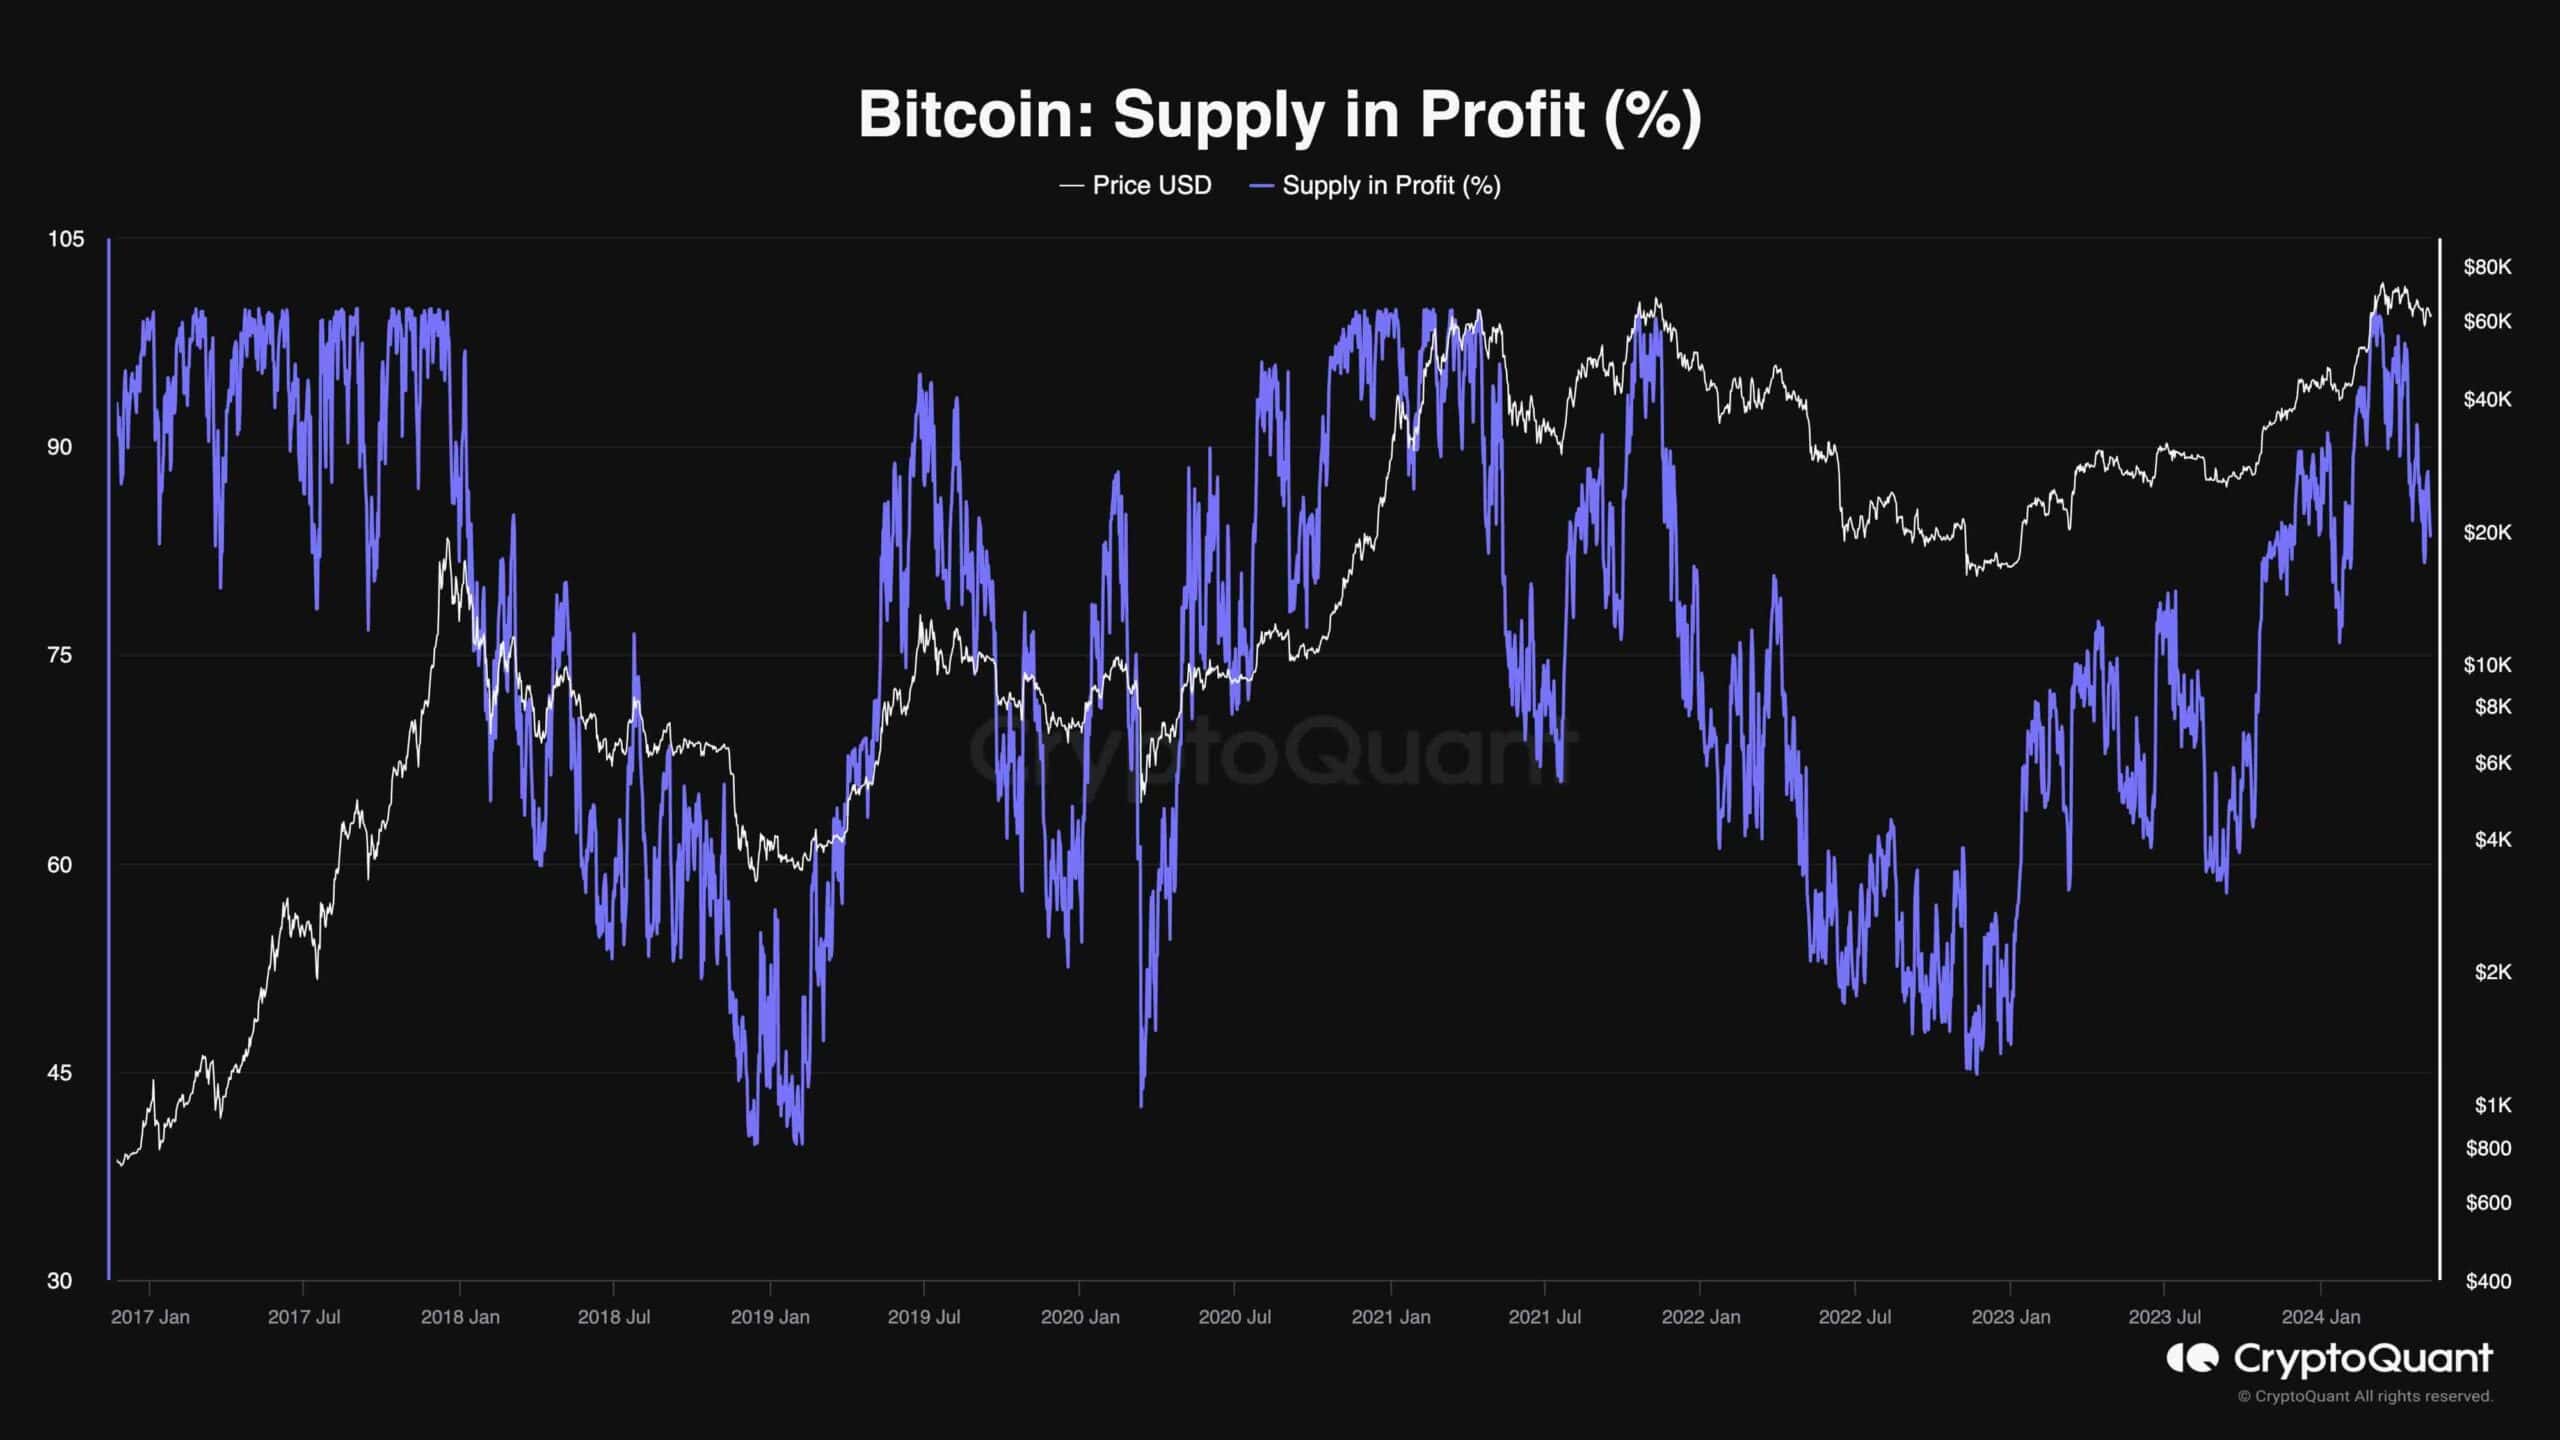
Profitability is pivotal in market psychology, particularly when macroeconomic conditions don’t favor risk assets. Therefore, analyzing participants’ profitability offers valuable insights into the market’s state and sentiment. The chart illustrates the Supply-in Profit (%) metric, representing the proportion of Bitcoin’s supply-in profit.
As depicted in the graph, the metric has recently surged to its highest levels, indicating that many participants may be considering realizing profits, potentially leading to increased selling pressure. Historically, such elevated levels have often preceded market volatility and potential downturns as holders begin to liquidate their positions.
However, despite a notable decline in the metric, the price has only undergone slight consolidation, suggesting that the recent decline might be a corrective movement triggered by profit realization. It’s plausible that once the correction stage concludes, the price will likely initiate a fresh, impulsive surge.