A popular crypto trader thinks that the most recent correction allowed Bitcoin (BTC) to solidify the final base of its multi-month parabolic ascent.
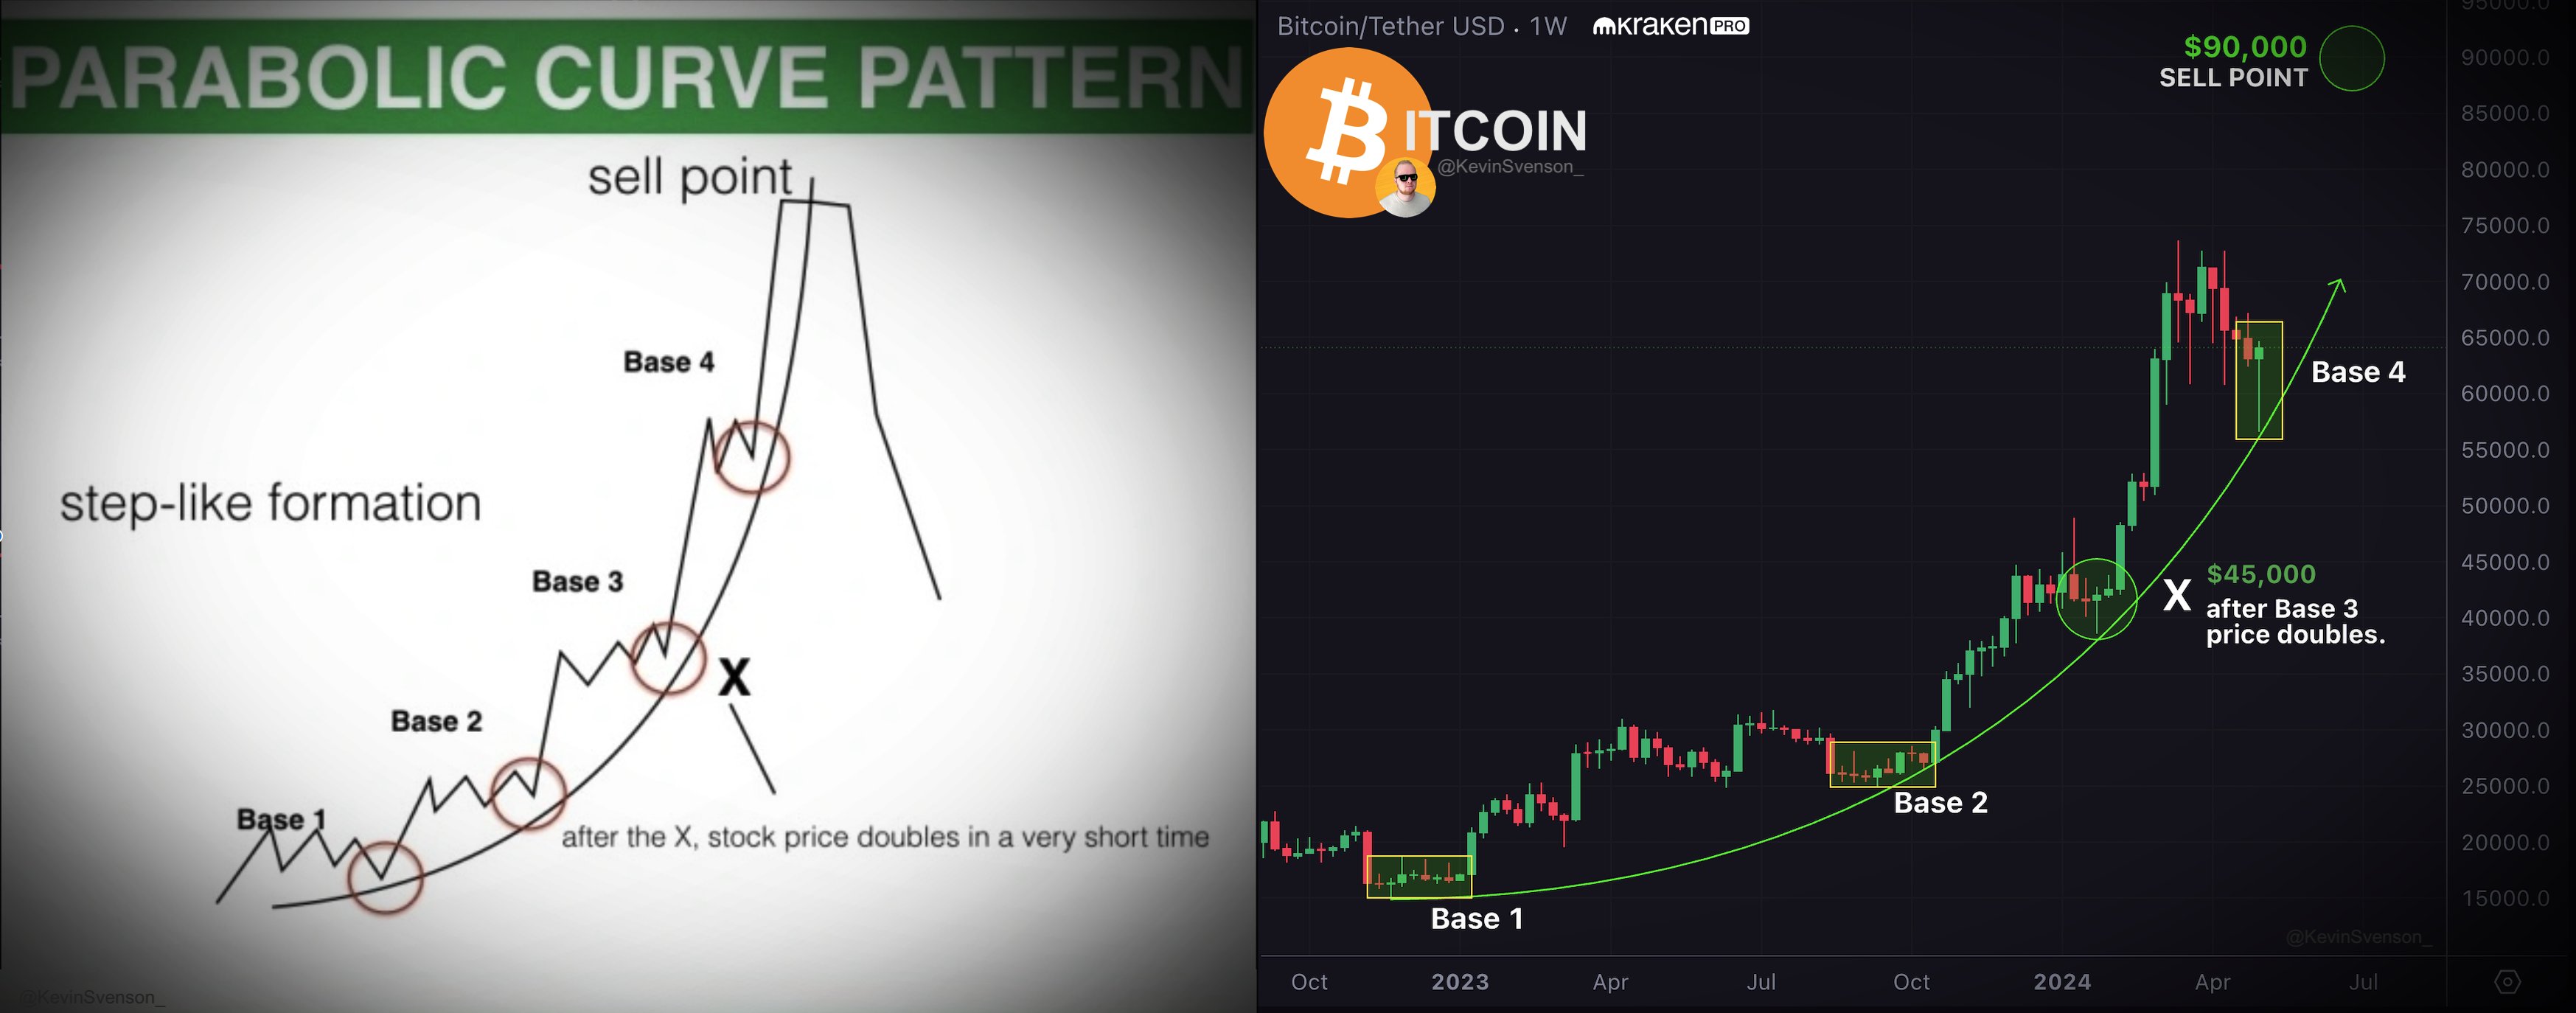
Analyst Kevin Svenson tells his 144,300 followers on the social media platform X that Bitcoin may have just completed base four of its parabolic curve pattern.
The crypto strategist shares a chart indicating that Bitcoin is now poised to rally to the pattern’s price target of $90,000.
“BITCOIN | Parabolic Trend
Now entering the stage where the parabola becomes obvious.
I’ve been screaming from the rooftops about this potential for the past year. Here we are. It’s real.”
Svenson’s stance on Bitcoin comes as he says two momentum indicators have flipped bullish for BTC. According to the analyst, Bitcoin’s moving average convergence divergence (MACD) and relative strength index (RSI) indicators on the daily chart have swung to the side of BTC bulls.
“BITCOIN | Daily Chart | MACD + RSI
BTC’s first positive MACD in 50+ Days.
BTC broke above the 65+ day RSI downtrend.
The picture is certainly shifting here.”

Svenson takes his bullish outlook on BTC a step further, saying that Bitcoin’s bull market will not end once the crypto king hits $90,000.
“People jump to the conclusion that this is my bull cycle prediction. They assume $90,000 is my cycle peak target. That is not the case…
I do expect a major correction after $90,000, but we are still very early in this cycle. The BTC halving JUST happened. There will be a lot more action after this.”
At time of writing, Bitcoin is trading for $63,711.
Generated Image: DALLE3