- Bitcoin price analysis is bearish today.
- BTC is looking for support above the psychological mark of $60,000.
- Bitcoin loses 16 days gains in just 12 hours.
The Bitcoin price analysis reveals that the coin continues to fall like a rock in a landslide. Although the coin was on the decline from yesterday when the price fell from $65437 and was capped at $63606 at the end of the day, and the King coin continued downside today, losing gains accumulated during November as the price is trading exactly at the point, from where it was uplifted on 2nd November.
Today the broader cryptocurrency market reports negative market sentiment, following the precedence set by the leader Bitcoin, as we know most of the coins follow the trade route of Bitcoin. Most of the top altcoins report losses ranging from seven percent to 14 percent over the last 24 hours.
BTC/USD 1-day price chart: BTC continues looking for support above $60k
The 24-hour Bitcoin price analysis shows that BTC/USD pair is still on a downwards trend, as now bulls are looking to hold on to $60507 support, which seems to be going under a test soon. The supports of $6338 and $61531 set earlier by the bulls have already been breached today, and now the next-in-line support is $60507. Overall the BTC/USD pair reports a loss in value of 7.72 percent over the last 24 hours, and a loss of almost 11 percent over the past week, due to which the market cap has also suffered, but the trading volume went up by 49.4 percent.
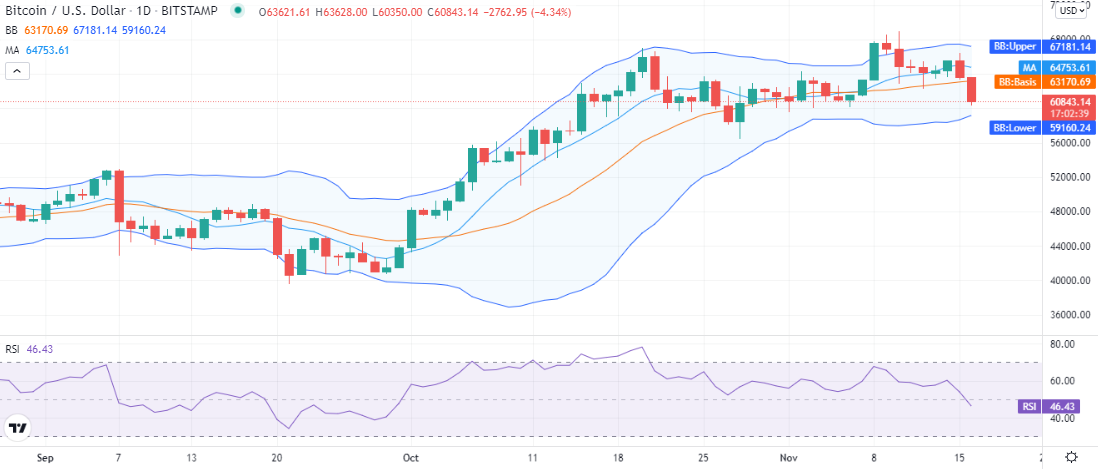
BTC shows mild volatility, as the volatility indicator shows a slight convergence with the upper Bollinger band at the $67181 mark, and the lower band at the $59160 mark representing support for the falling price of BTC, in contrast, the mean average of the Bollinger bands at the $63170 mark represents support for the King crypto.
The shape of the Bollinger bands indicator hints at low volatility to be expected for the coming days, so we can expect the price oscillations to be slow as well, which sets us to assume the price to trade near the $60k psychological mark, oscillating above and below the said level while it consolidates for a further move higher.
The relative strength index (RSI) is trading at a downwards slope indicating the selling activity in the market, with no bullish support yet observed. The RSI is present at index 46 in the lower half of the neutral zone.
Bitcoin price analysis: Recent developments and further technical indications
The 4-hour Bitcoin price analysis shows that BTC continues to fall as bears are plunging it further below and haven’t received any help from the bullish side yet, in contrast, Ethereum was observed getting the bullish help recently, but the case of the BTC seems more severe comparatively.
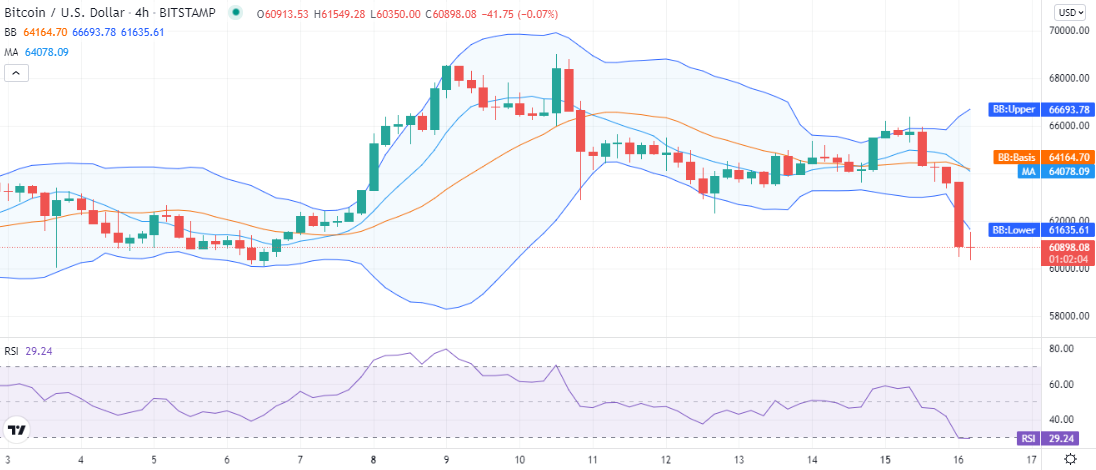
The volatility on the 4-hour chart is high, and the price continues downside below the lower limit of the volatility indicator. The RSI has also stepped down into the undersold zone as it trades at index 29. However, after getting into the undersold zone, the RSI curve has taken a turn horizontally, indicating a slow down in the selling activity.
Overall the technical indicators have turned bearish for BTC/USD as now 10 technical indicators suggest selling options for BTC, including the MA10, EMA10, and the MACD and Momentum oscillators, and only six technical indicators suggest buying options.
Bitcoin price analysis: Conclusion
The Bitcoin price analysis suggests the King crypto haven’t found support yet to hold on while it is in a state of a free fall today. Most of the previous support zones have now turned into resistance. However, the BTC has not fallen below the psychological mark of $60k, and we expect it to be rescued before slipping below the said level. However, today’s plunge has provided a chance to the traders waiting to buy the dip.
Disclaimer. The information provided is not trading advice. Cryptopolitan.com holds no liability for any investments made based on the information provided on this page. We strongly recommend independent research and/or consultation with a qualified professional before making any investment decisions.