Historical data of the “coin days destroyed” indicator versus the Bitcoin price may suggest the metric can help predict tops.
The Bitcoin Coin Days Destroyed (CDD) Indicator
As explained by an analyst in a CryptoQuant post, the coin days destroyed metric might be a reliable indicator for BTC tops.
A “coin day” is defined as the number of days that a BTC coin has been unspent for. One Bitcoin remaining unspent for one day accumulates one coin day. Other amounts of coins follow linearly from this relation. For example, 0.5 BTC would have only half a coin day in the same period (one day).
When these coins are spent, the coin days are “destroyed” in a sense as the value would reset back to zero for the coins. The metric that keeps track of the amount of coin days being destroyed is precisely the CDD indicator.
The coin days metric is helpful for getting an estimate of the long-term holders present in the market. So the CDD indicator can tell us about how many of these long-term holders are selling right now.
A sharp increase in CDD’s value could suggest that a lot of long-term holders have sold off their coins as these investors have many coin days piled up so them being destroyed would show up as an equally bigger increase in the metric’s value.
Related Reading | ETF approval drives Bitcoin towards all-time high at $65K – Crypto Weekly Roundup, October 18, 2021
Now, here is how the history of the indicator has looked like for Bitcoin:
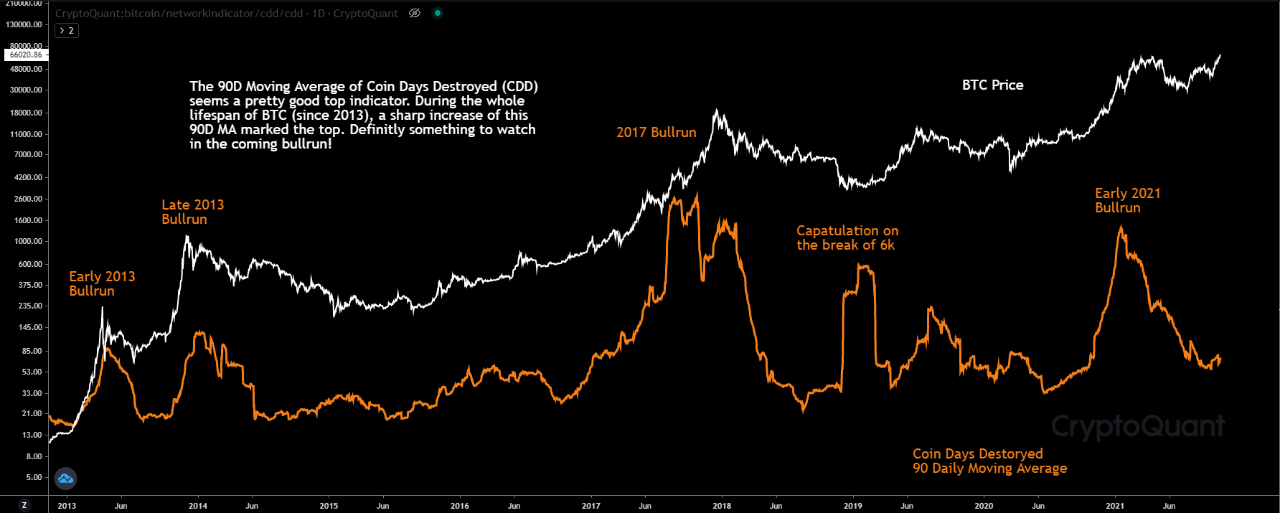
CDD vs BTC price over the course of the crypto's entire history | Source: CryptoQuant
In the above chart, the analyst has marked all the important bull runs in the history of the coin. Interestingly, whenever the indicator has made a sharp spike, Bitcoin has made a top.
Related Reading | deVere CEO: Bitcoin Cemented As “Mainstream,” “Investors Should Consider” Crypto
The trend makes sense as a lot of long-term holders dumping their coins would naturally lead to a dip in the Bitcoin price.
However, the metric hasn’t always been perfect. As the latest bull run in early 2021 shows, CDD peaked earlier than the actual top and its value was much lower when the real top was made. And in 2017, the indicator made a false peak before the real top.
BTC Price
At the time of writing, Bitcoin’s price floats around $63k, up 6% in the last seven days. Over the past month, the crypto has gained 50% in value.
The below chart shows the trend in the price of BTC over the last five days:
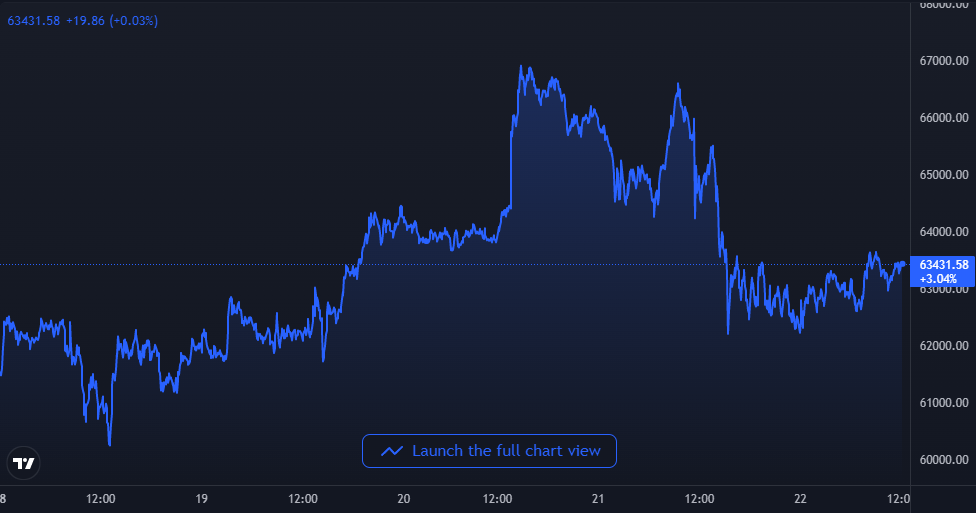
BTC's price corrects lower after making a new ATH and moves sideways over the past day | Source: BTCUSD on TradingView
Featured image from Unsplash.com, charts from TradingView.com, CryptoQuant.com