The Bitcoin dominance rate (BTCD) has bounced just prior to reaching a new all-time low price and potentially initiated a new upward movement.
It is possible that BTCD has reached its bottom, and will move upwards after a short-term correction.
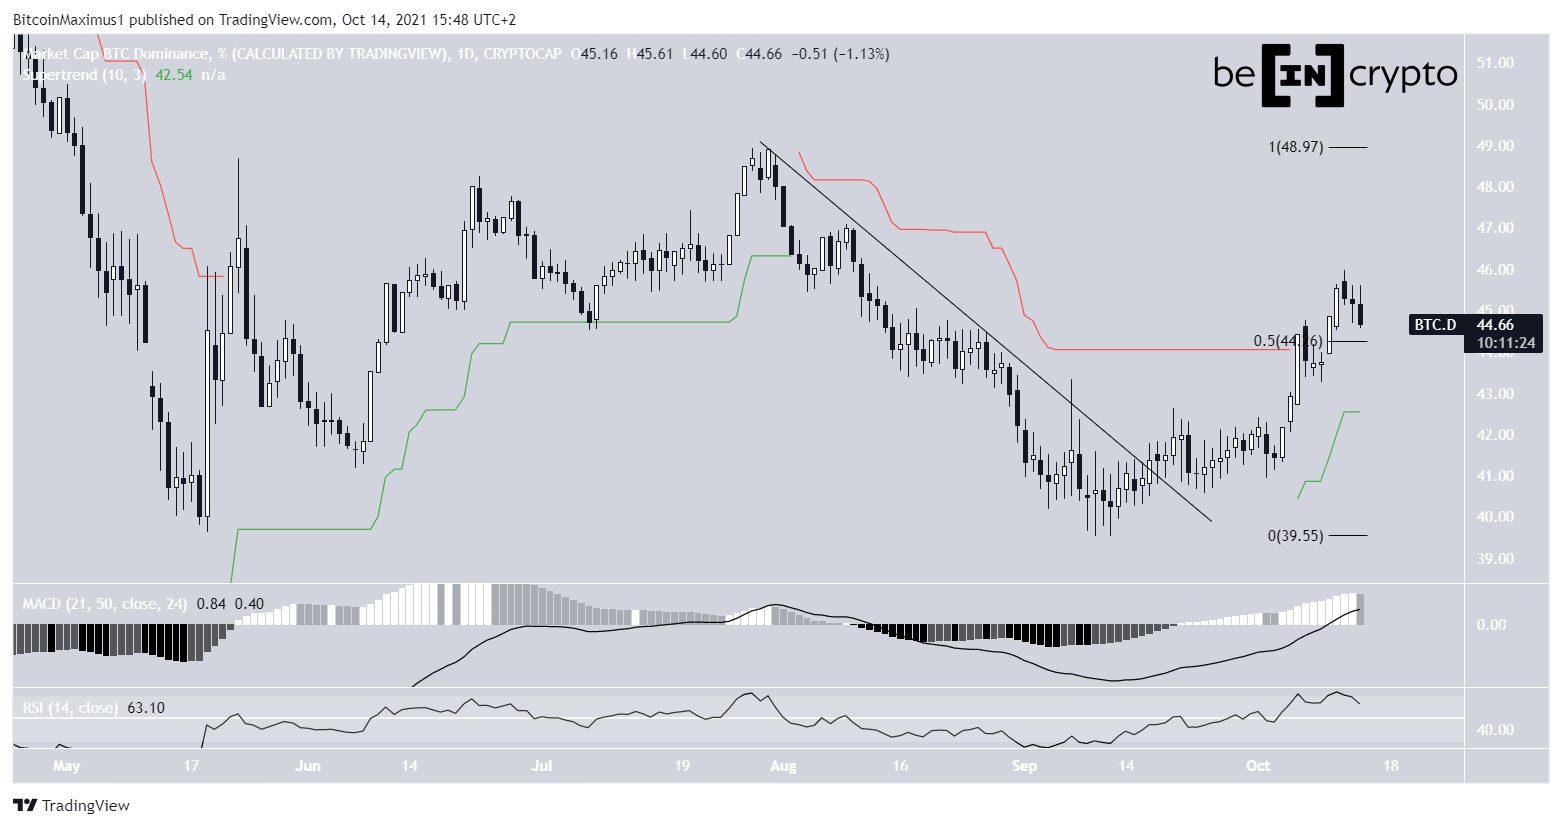
Ongoing BTCD breakout
On Sept 17, BTCD broke out from a descending resistance line, which had previously been in place since July 30. This indicated that the previous downward movement had come to an end and the BTCD trend is now bullish.
More importantly, BTCD managed to move above the 44.5% crucial resistance area. The area is important since it is the 0.5 Fib retracement resistance level and coincided with the Supertrend resistance line.
The Supertrend is an indicator that uses absolute high and low prices in order to determine the direction of the trend. Since BTCD is now above the Supertrend line, the trend is considered bullish. This is evident by the green supertrend line.
It remains to be seen whether the 44.5% area will not act as support.
Readings from both the MACD and RSI are also bullish. The former, which is created by short- and long-term moving averages (MA), is positive and increasing. This means that the short-term trend is faster than the long-term one. Also, it shows that it is increasing at a faster rate.
The RSI, which is a momentum indicator, has moved above 70. This is a sign that the trend is bullish, despite being overbought.
Therefore, technical indicators in the daily time-frame suggest the trend is bullish.
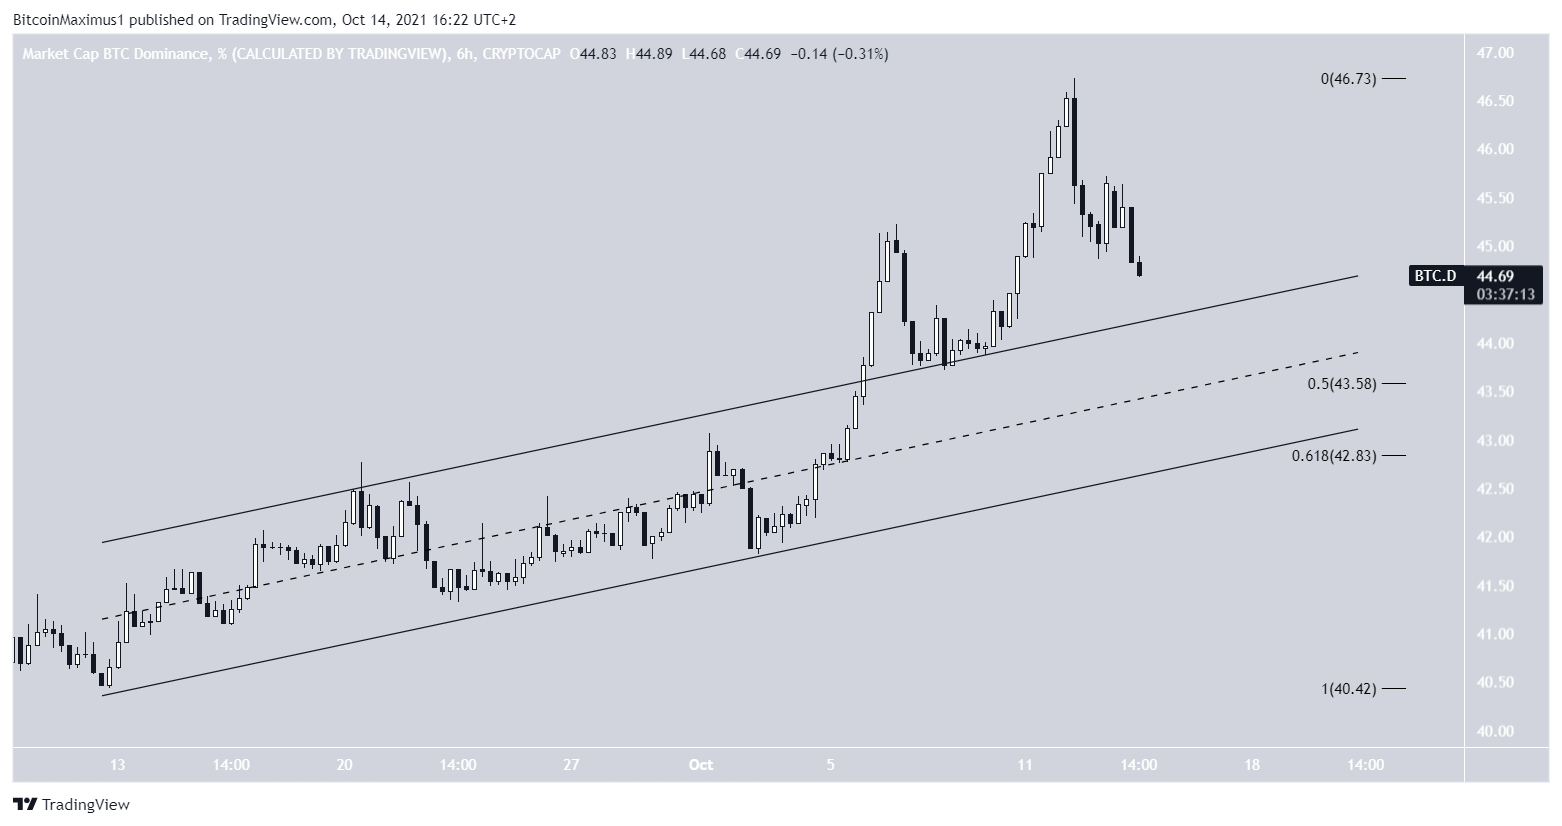
Short-term movement
The shorter-term six-hour chart supports the continuation of the upward movement, since it shows that BTCD has broken out from a short-term ascending parallel channel.
Such channels usually contain corrective movements. In this case, this would mean that the upward movement was corrective, and the downward trend would resume afterwards.
However, since BTCD break out, it indicates that the upward movement is impulsive, meaning that the current trend is upwards.
There is strong support at 43.6 and 42.8%. The first area is created by the 0.5 Fib retracement level and the middle of the channel. The second one is created by the 0.618 Fib retracement level.
A decrease below the second one would put the possibility that BTCD is bullish in doubt.
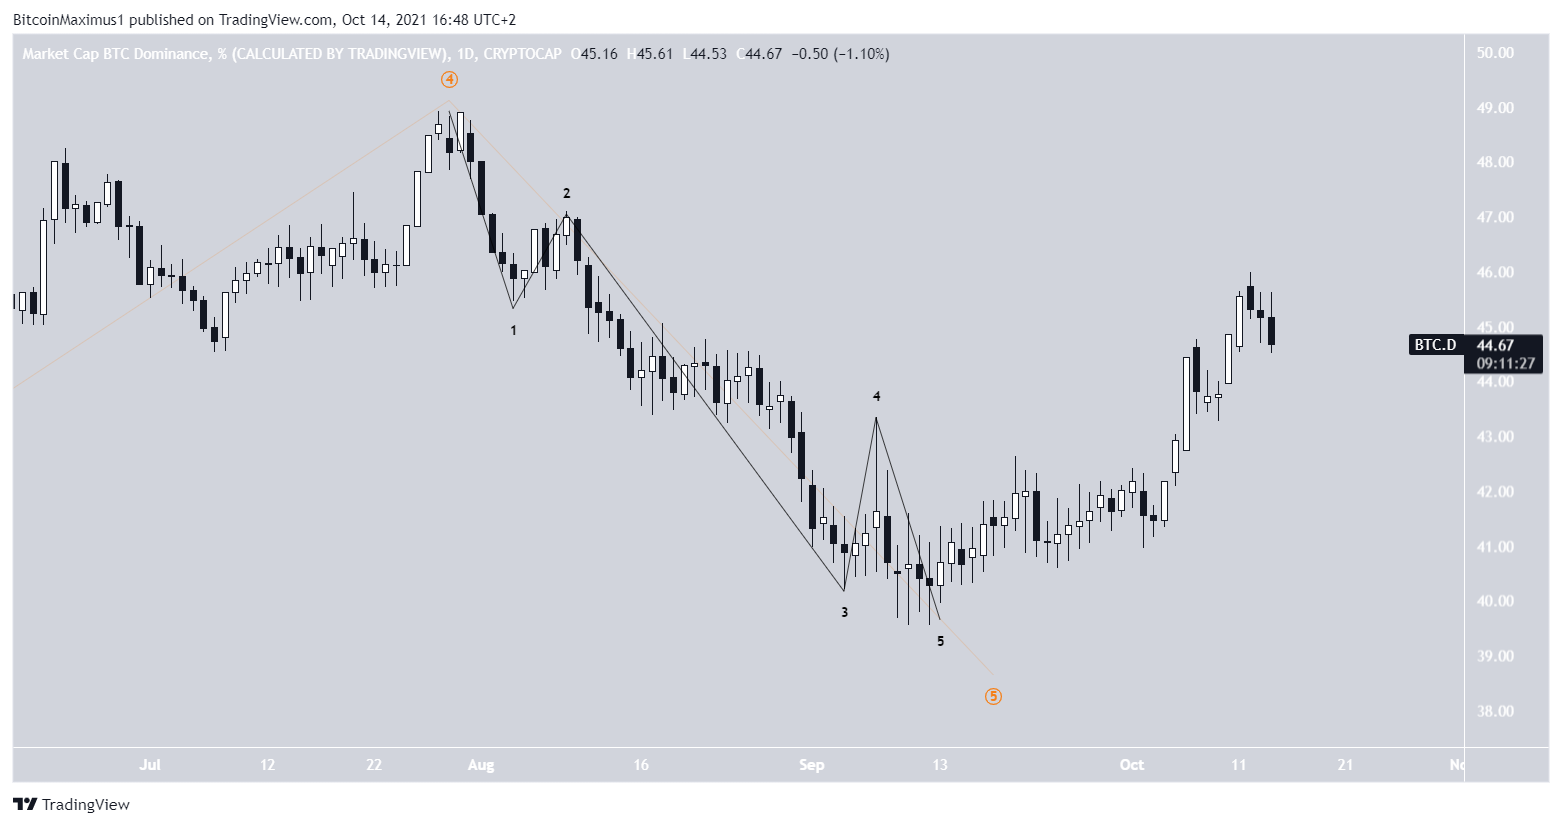
Wave count
Cryptocurrency trader @Pentosh1 outlined a BTCD chart, stating that alts are continuing their bleeding.
There are two potential wave counts in play.
The first one suggests that BTCD has one more drop to go prior to reaching a bottom.
It shows that BTCD is in the fifth and final wave of a downward movement that has been going on since January.
The most likely target for the bottom of the movement is between 34-36%. The target is found using an external retracement on wave four (black) and the length of wave one (orange).
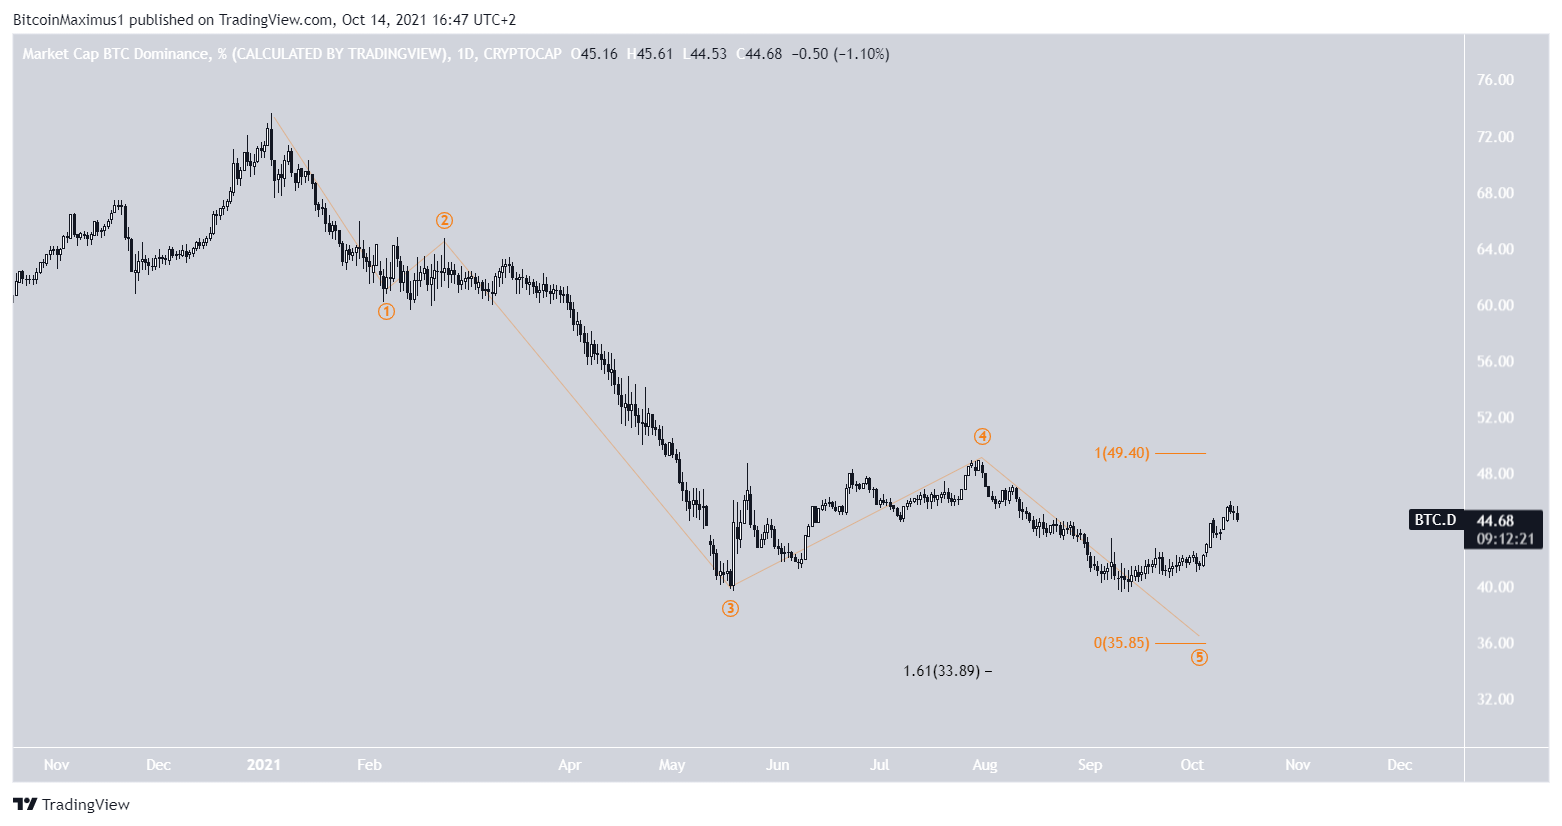
However, a closer look shows the final portion of the downward movement has had five waves. This means that the downward movement has possibly reached its end, even though the actual low was reached in May.
When combined with the bullish readings from the daily time-frame, the second count seems to be more likely.