
|
|
Theta token is a Non-Fungible Token(NFT) of the decentralized Theta blockchain network that facilitates seamless video streaming. It is a highly secured and hack-free network with end-to-end encryption. It is an open-source protocol that supports the creation of decentralized apps and multiple content verticals. Let us look at technical analysis for the same.
Past Performance
On Jun 21, 2021, $THETA opened at $8.70. On Jun 27, 2021, $THETA closed at $6.89. Thus, in the past week, the $THETA price has declined by roughly 21%. In the last 24 hours, $THETA has traded between $6.36 – $6.95.
https://s3.tradingview.com/snapshots/0/0A8ETWAb.png
Day-Ahead and Tomorrow
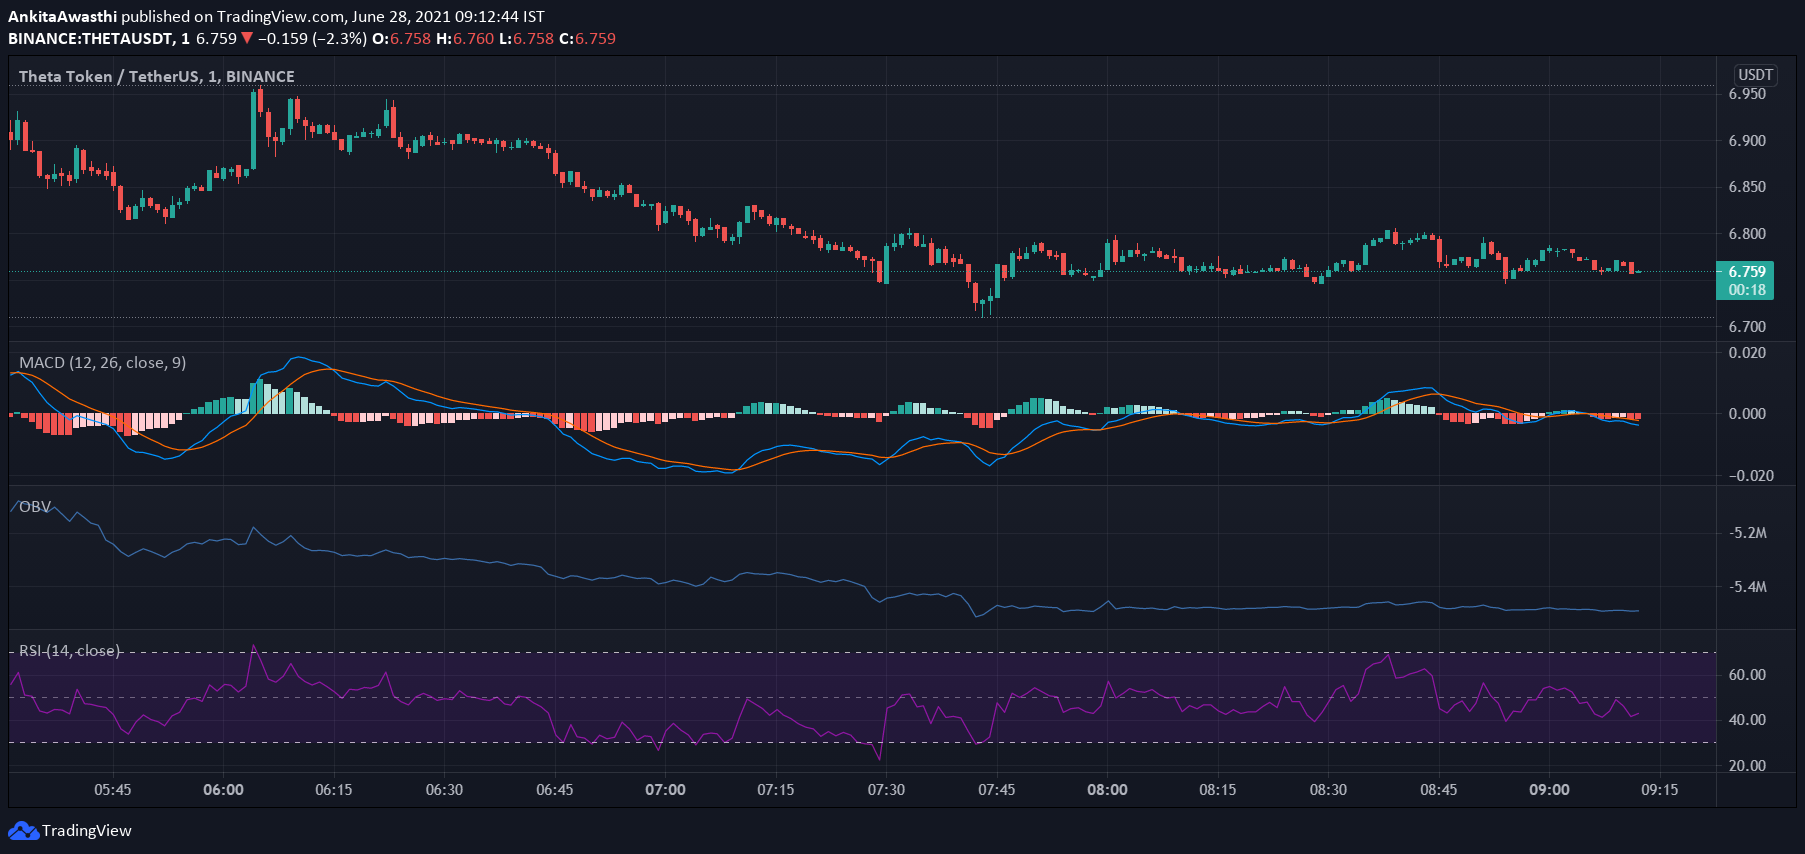
Currently, $THETA is trading at $6.77. The price has decreased from the day’s opening price of $6.89. Thus, the market seems bearish.
The MACD and signal lines are negative. Moreover, a bearish crossover by the MACD line over the signal line has occurred. Thus, the overall market momentum is bearish. Hence, we can expect the price to fall further.
Currently, the RSI indicator is at 50%. It faced rejection at 41% and rose to the current level. Hence, buying pressures are mounting. High buying activity will exert upward pressure on the $THETA price.
However, the OBV indicator has fallen steeply. Thus, selling volumes are higher than buying volumes. High selling activity will push the price further down.
In short, the MACD and OBV oscillators have given negative signals whereas the RSI indicator has given positive signals. Thus, as of now, the overall market momentum is bearish. However, we have to wait and watch if intermittent price rises are market corrective action or signs of a bearish trend reversal.
$THETA Technical Analysis
Currently, the price is below the first Fibonacci pivot resistance level of $6.96. It may soon fall below it and further below the Fibonacci pivot point of $6.73. If bears remain strong till day end, the price may further fall below the first, second, and third support levels of $6.51, $6.37, and $6.14, respectively.
The price may soon test and fall below the 61.8% FIB retracement level of $6.72. The price may further fall below the 50% FIB retracement level of $6.65 as well. Thus, as of now, the bears seem strong. In that case, the price downswing may continue today and tomorrow.