Litecoin was developed to provide a faster and safer digital payment platform. It has a very low transaction fee, which makes it suitable for low transaction amounts and point-of-sale payments. LTC is one of the most widely accepted cryptocurrencies, more than 2000 stores globally accept LTC. Technical analysis of LTC as follows.
Past Performance
On June 7, 2021, LTC opened at $176.54. On June 13, 2021, LTC closed at $170.93. Thus, in the past week, the LTC price has decreased by approximately 3.17%. In the last 24 hours, LTC has traded between $156.96 – $171.94.
https://www.tradingview.com/x/NLThk9np/
Day Ahead And Tomorrow
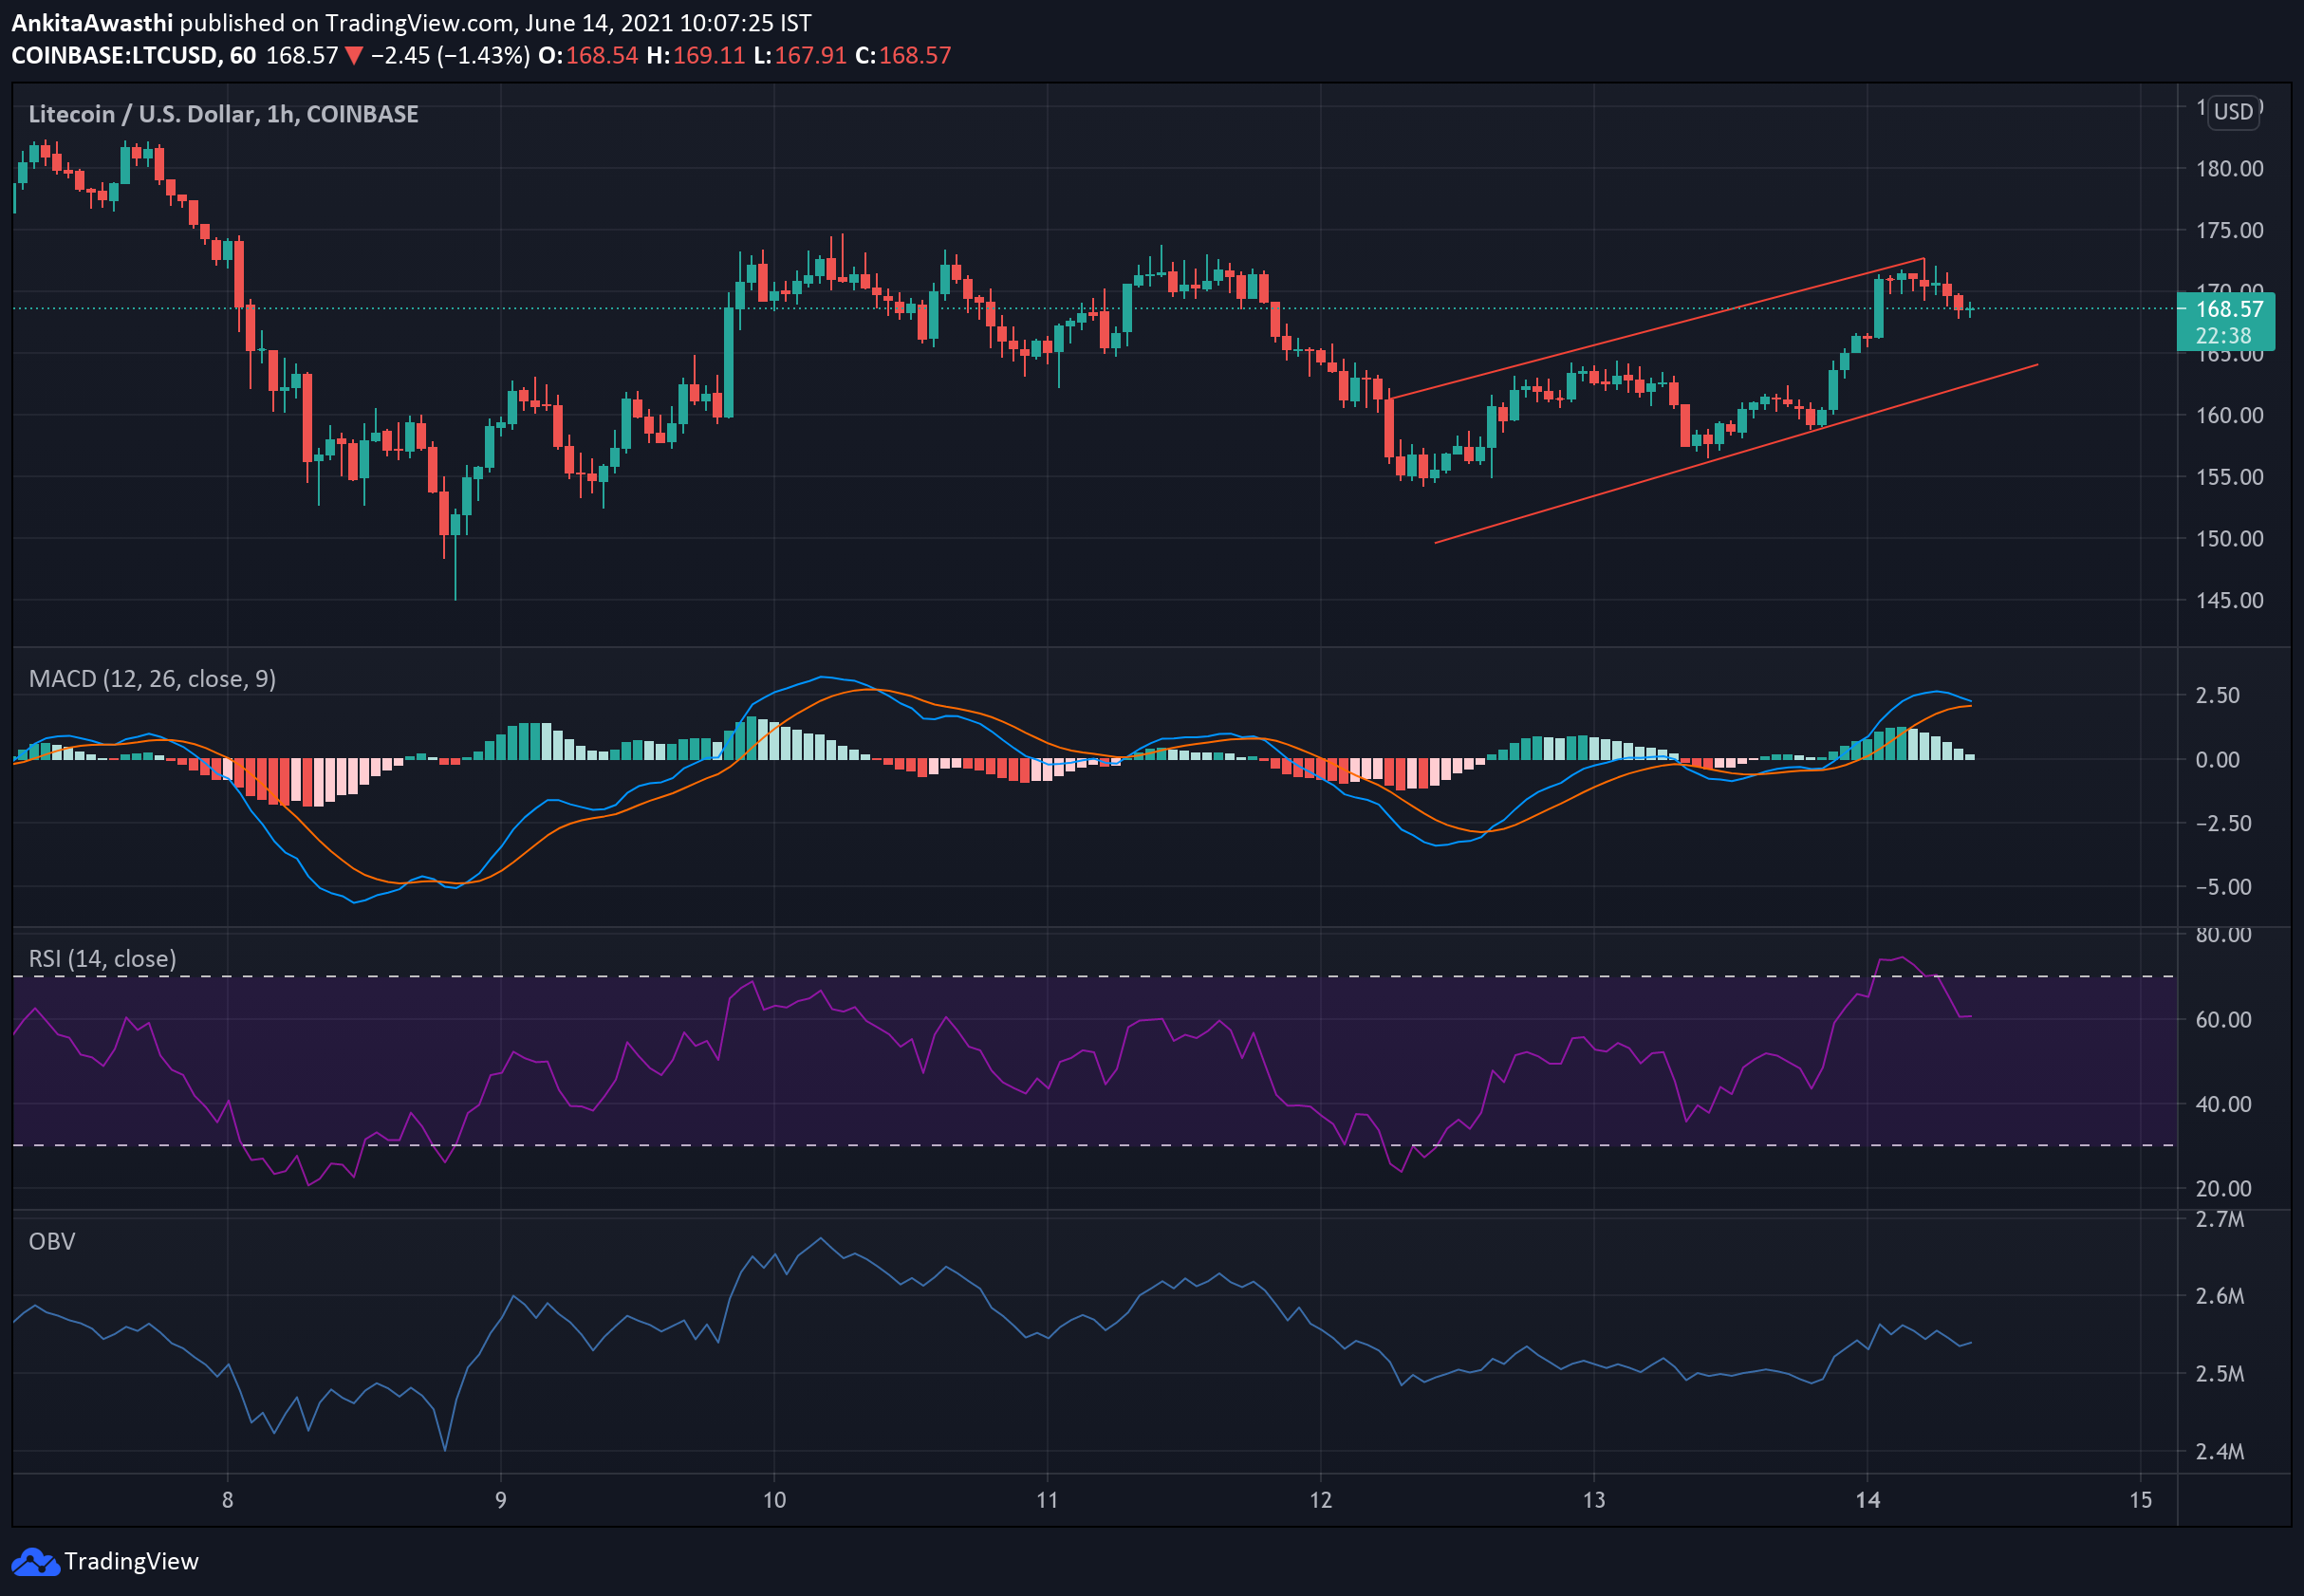
Currently, LTC is trading at $168.63. The price has increased from the day’s opening price of $158.20. Thus, the market seems bullish.
On the hourly chart, the MACD and signal lines are in the positive zone. However, a bearish crossover by the MACD line over the signal line has occurred. Thus, the overall market momentum seems bearish. Hence, the price may fall further.
Currently, the RSI indicator is at 60%. It faced rejection at 57% and rose to this level. Thus, buying pressures are slowly mounting for LTC. We have to wait and watch if buying pressures become strong enough to bring about a bearish trend reversal.
On the hourly chart, the OBV indicator is downward sloping. Thus, selling volumes are higher than buying volumes. High selling activity will exert downward pressure on the LTC price.
In short, when we look at all three oscillators, we can say that the price may continue to rise. However, we cannot rule out the possibility of a trend reversal. We have to wait and watch to see if an intermittent price rise is a corrective action or the beginning of a positive trend.
LTC Technical Analysis
Currently, the price is below the second Fibonacci pivot point of $170.91. If the bears remain strong till day end, then the price is likely to fall below the first, second, and third support levels of $168.81, $166.46, and $164.57, respectively.
The price has been tested and fallen below the FIB retracement level of $172.59. It may soon fall below the 38.2% FIB retracement level of $166.46. Thereafter, we have to wait and watch if the price retests and breaks out of these levels. In that case, the price upswing is likely to continue tomorrow as well.
However, on the upside, if the resistance of level $171 is broken it will highlight the next resistance at $173, which can be kept as the target for the long call.