BeInCrypto takes a look at the eight altcoins that decreased the most over the past seven days, from June 4 to 11.
These altcoins are:
- Internet Computer (ICP): -38.86%
- Synthetix (SNX): -24.21%
- THORchain (RUNE): -23.36%
- BakeryToken (BAKE): -23.09%
- UMA (UMA): -21.97%
- Avalanche (AVAX): -21.90%
- SushiSwap (SUSHI): -20.85%
- SHIBA INU (SHIB): -20.62%
ICP
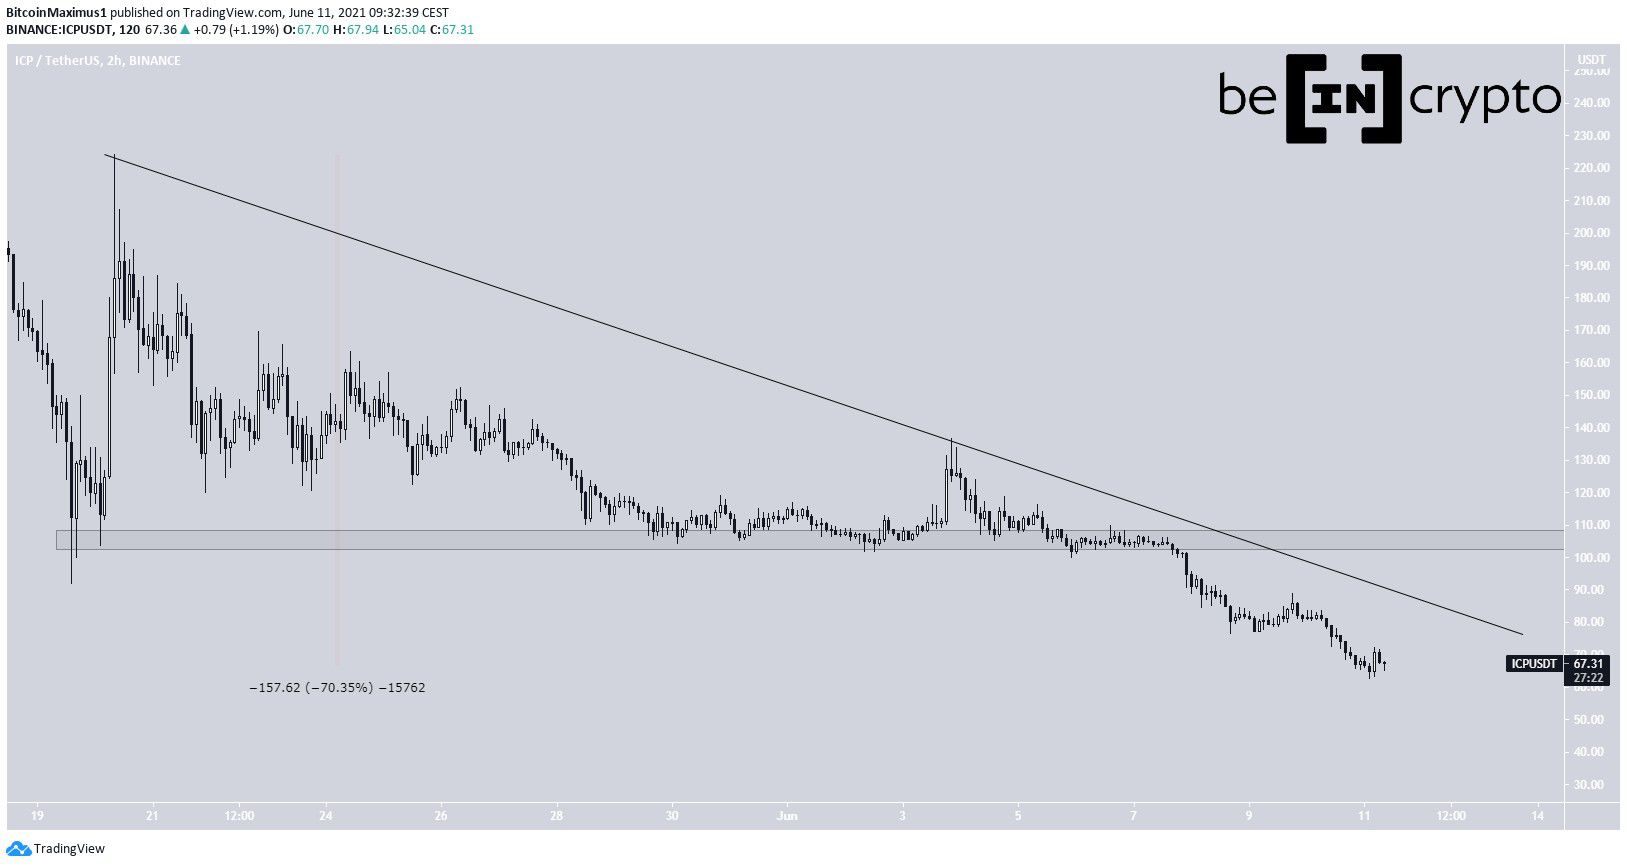
ICP has been decreasing since May 20, when it reached a high of $224. It has also been following a descending resistance line since then.
On June 11, ICP reached a new all-time low price of $62.67. This amounted to a decrease of 70% when measuring from the aforementioned high. It’s currently in bearish price discovery.
The trend is considered bearish until ICP breaks out from the descending resistance line and reclaims the $105 support area.
SNX
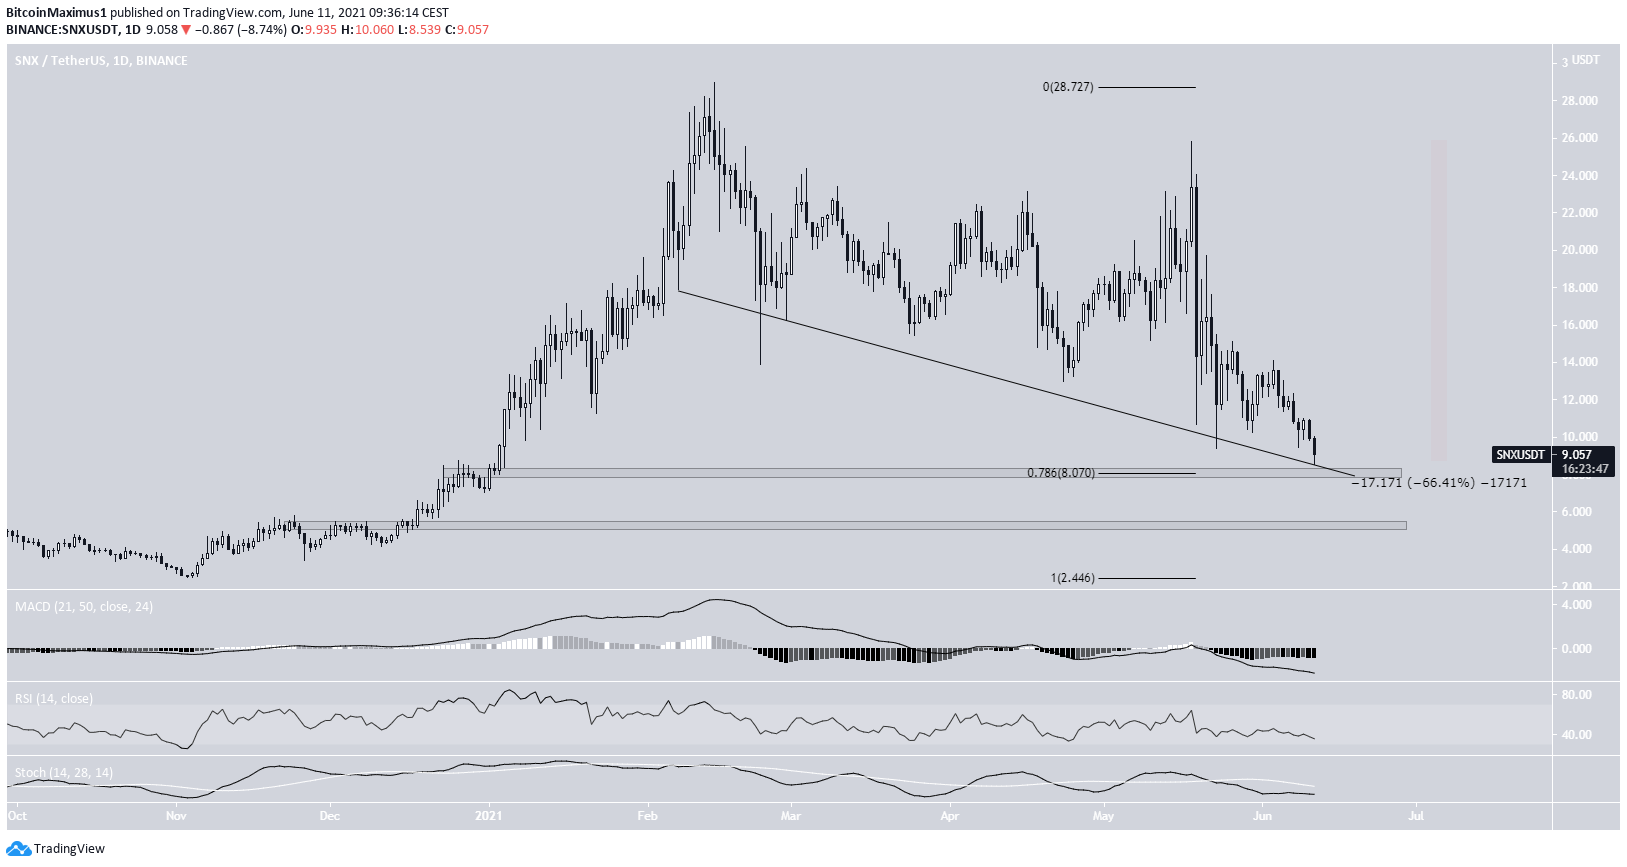
SNX has been decreasing since reaching a high of $28.10 on Feb. 13. It created a lower high on May 18 and began to decrease once again — this time at an accelerated rate.
So far, it has reached a low of $8.53 on June 11. This amounted to a decrease of 66.40% from the aforementioned all-time high.
The low was made very close to the $8.07 support area, which is the 0.786 Fib retracement support level. In addition, it coincides with a descending support line that’s been in place since the beginning of February.
However, technical indicators do not yet show any bullish reversal signs.
RUNE
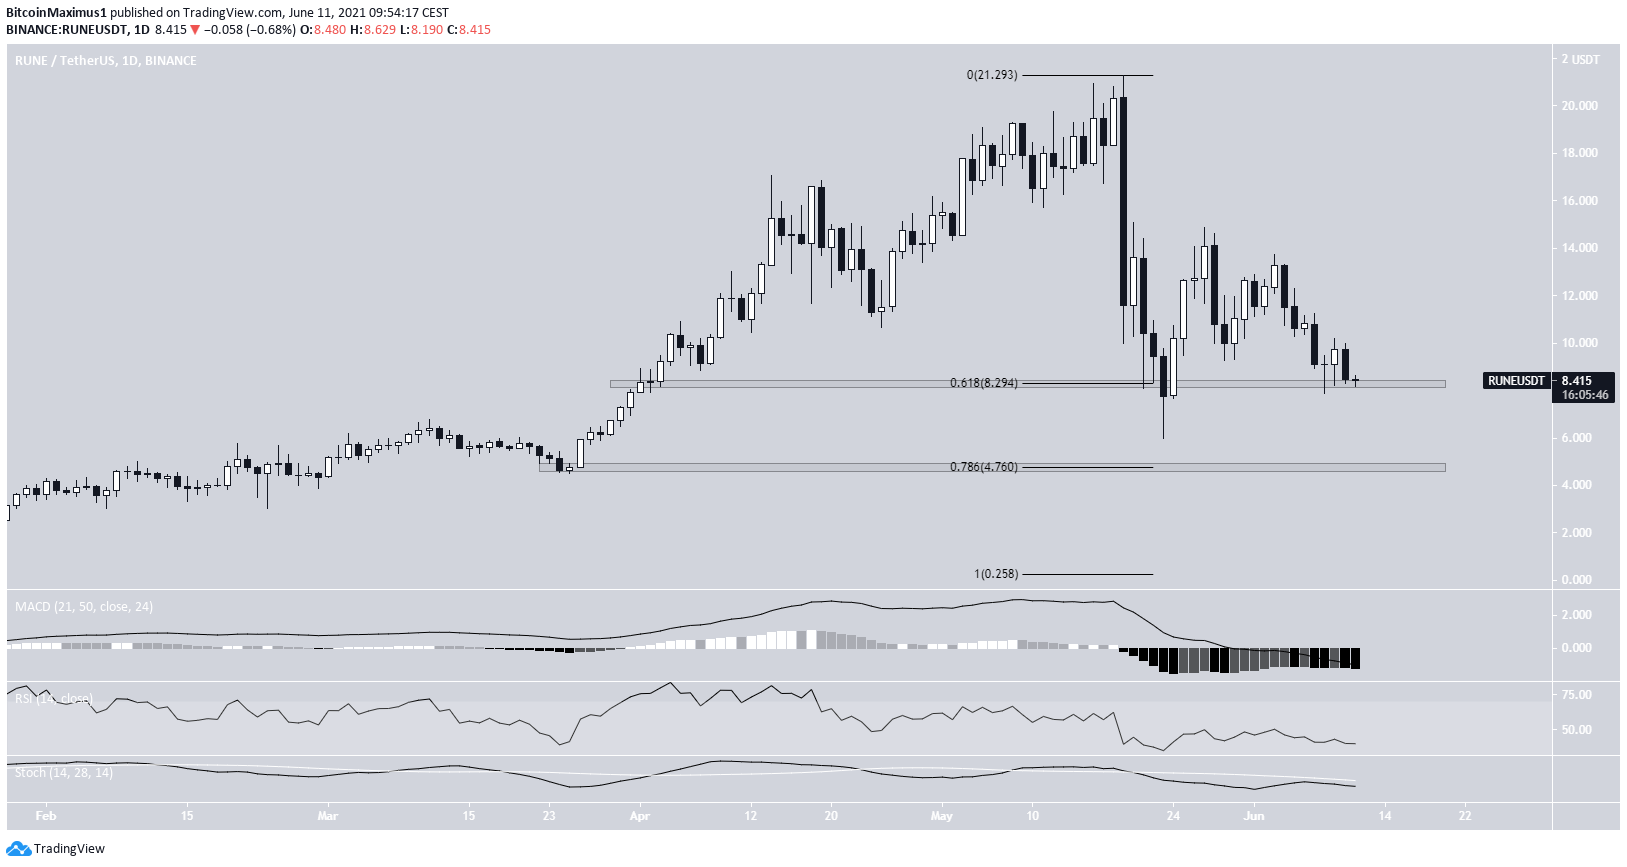
RUNE has been decreasing since May 19 after it reached a high of $21.28. The decrease has been sharp, leading to a low of $6.00 on May 23.
While RUNE bounced initially, it has returned back to the $8.30 support area, This is also the 0.618 Fib retracement support level.
Technical indicators do not yet show any bullish reversal signs. The next closest support area is found at $4.76 (0.786 Fib retracement support level).
BAKE
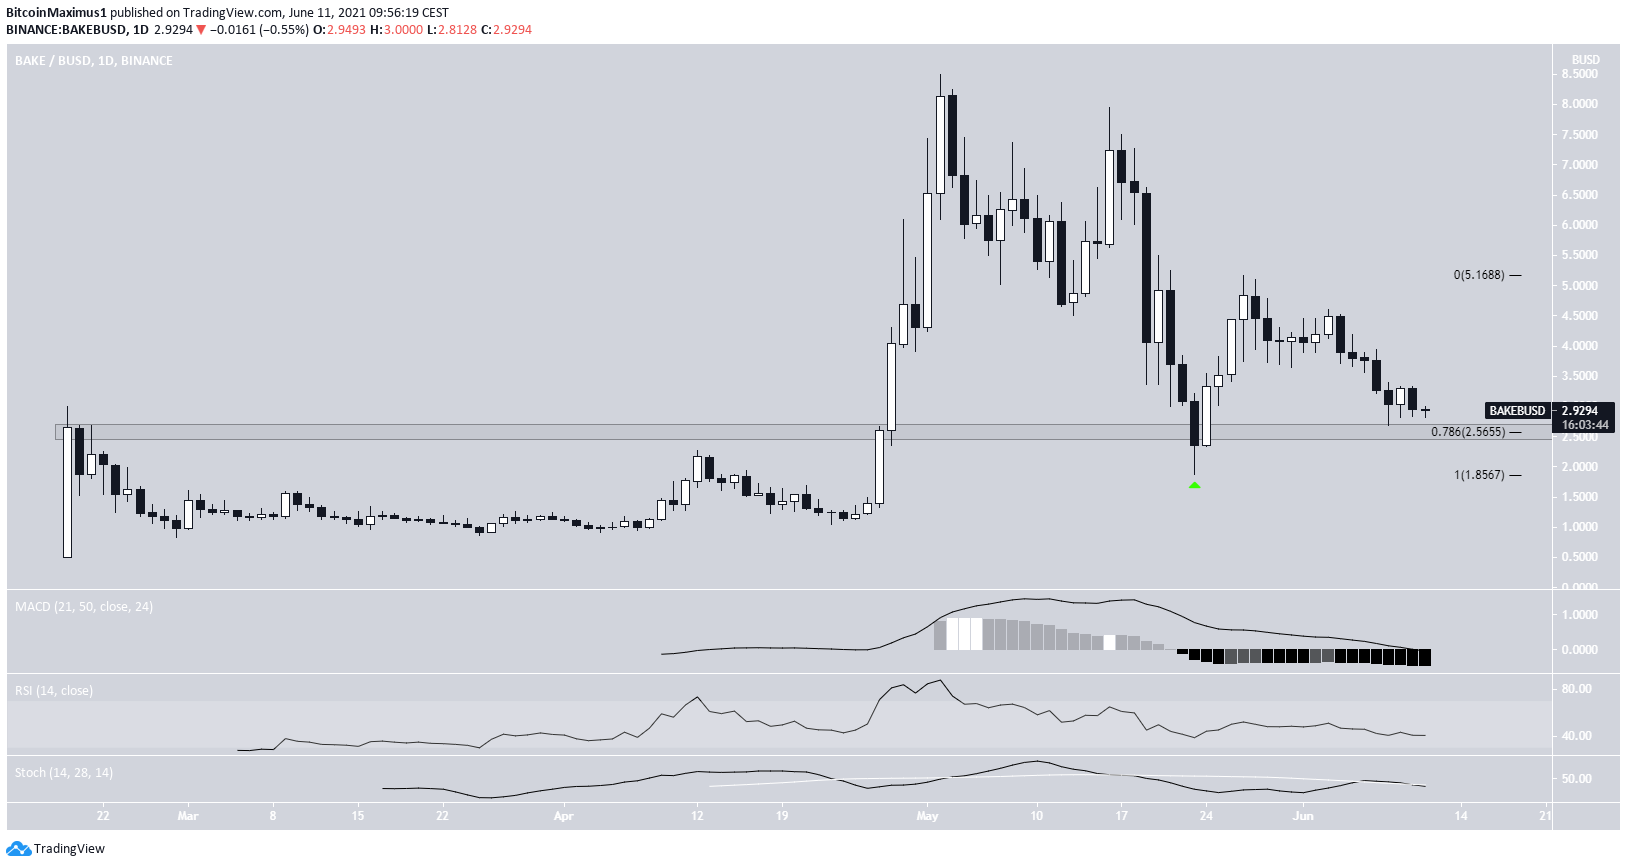
BAKE has been moving downwards since May 2 after reaching an all-time high price of $8.49. It created a lower high on May 16 and initiated another sharp downward movement after.
On May 23, it bounced after reaching a low of $1.86. The bounce validated the $2.56 area as support. This is the same level that had previously acted as resistance in February.
Currently, BAKE is returning towards the $2.56 level once again. Besides being a horizontal support area, it’s also the 0.786 Fib retracement support level of the most recent upward movement.
However, technical indicators do not yet show any bullish reversal signs.
UMA
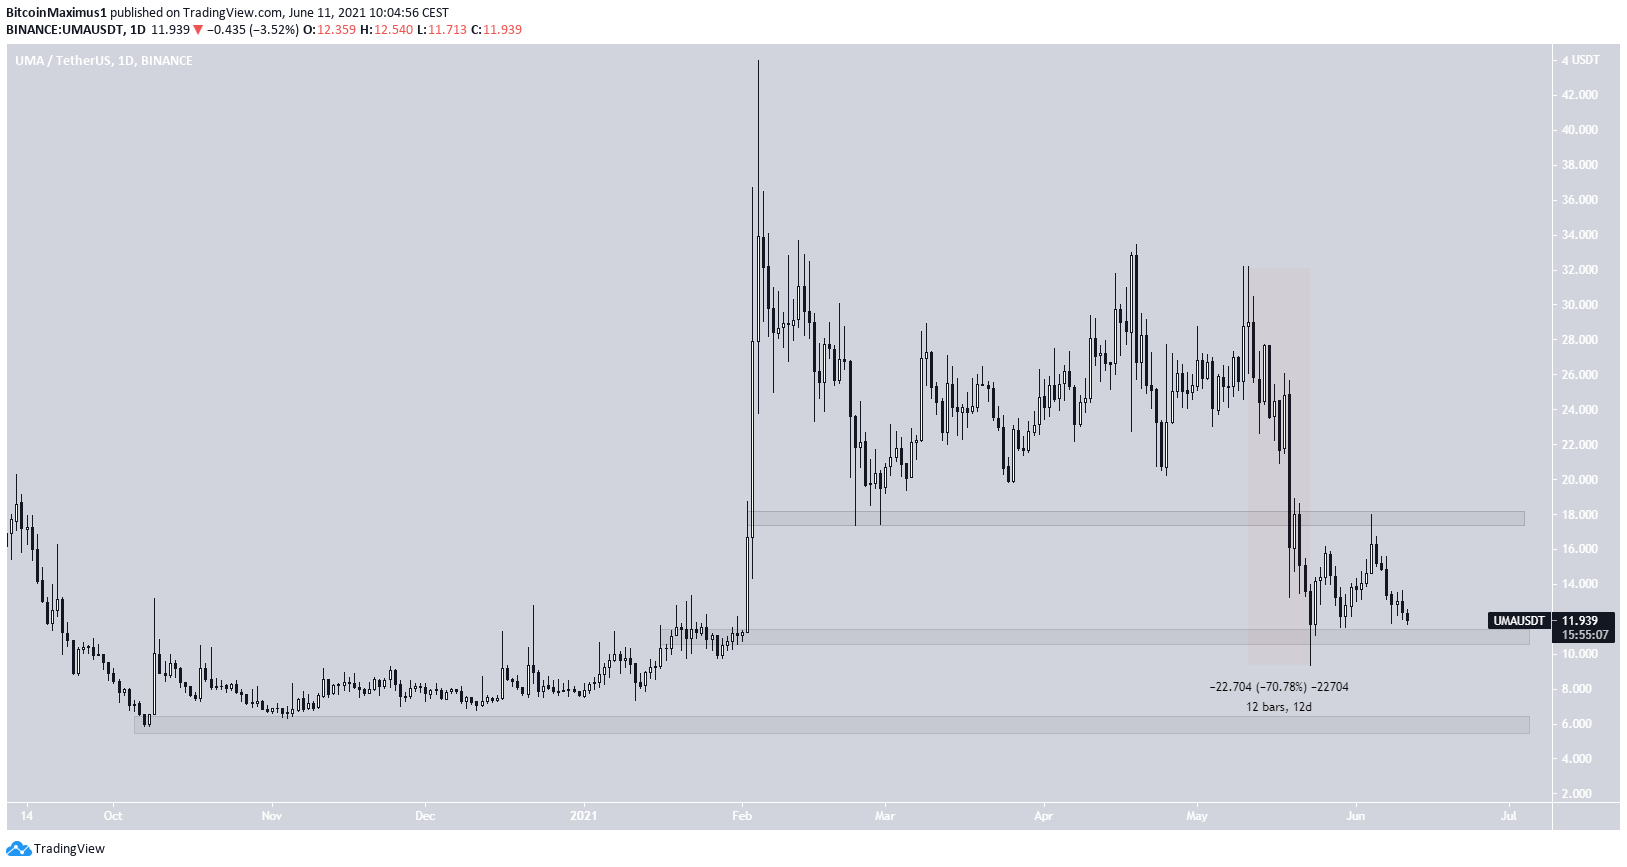
In a twelve-day period between May 11 and 23, UMA decreased by 71%, culminating with a low of $9.34 being reached on May 23.
The bounce that followed took UMA to a high of $17.98 on June 4. However, it was rejected by the $18 resistance area and fell once again.
UMA is approaching the $11 support area again and could start trading in a range between $11 and $18.
A breakdown below the $11 area could take UMA back toward its all-time lows.
AVAX
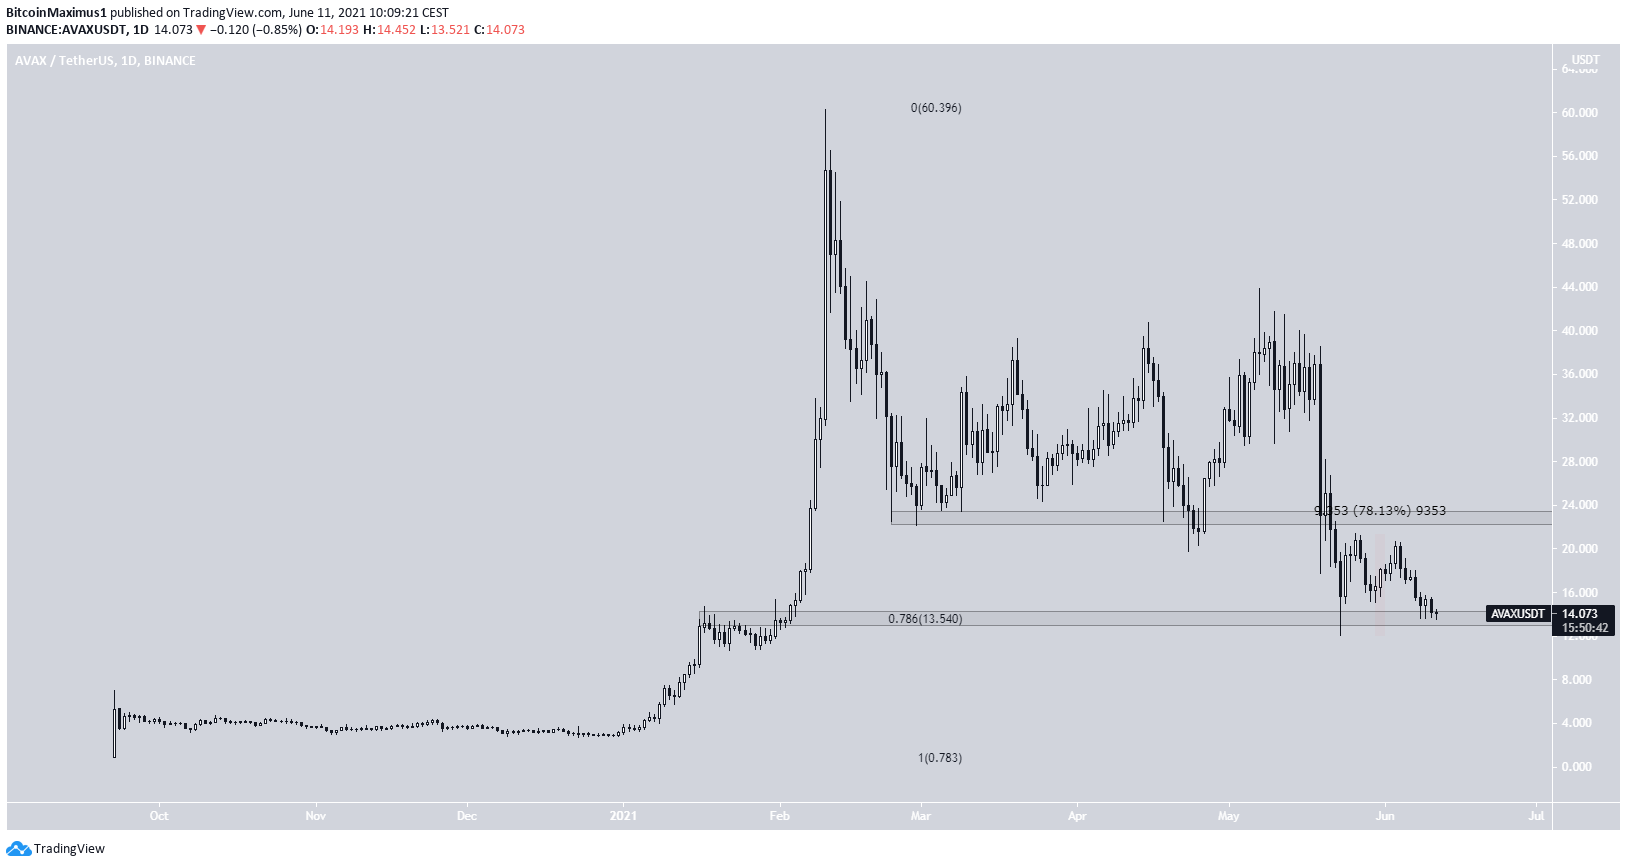
After a prolonged decrease, AVAX bounced at the $13.53 support area on May 23. However, it failed to reach the $23 resistance area, created a lower high, and has been moving downwards since June 2.
Currently, it has returned to the $13.50 support area again.
Similar to UMA, AVAX is potentially trading inside a range between $13.55 and $23. A breakdown below the former could take it towards its all-time low levels.
SUSHI
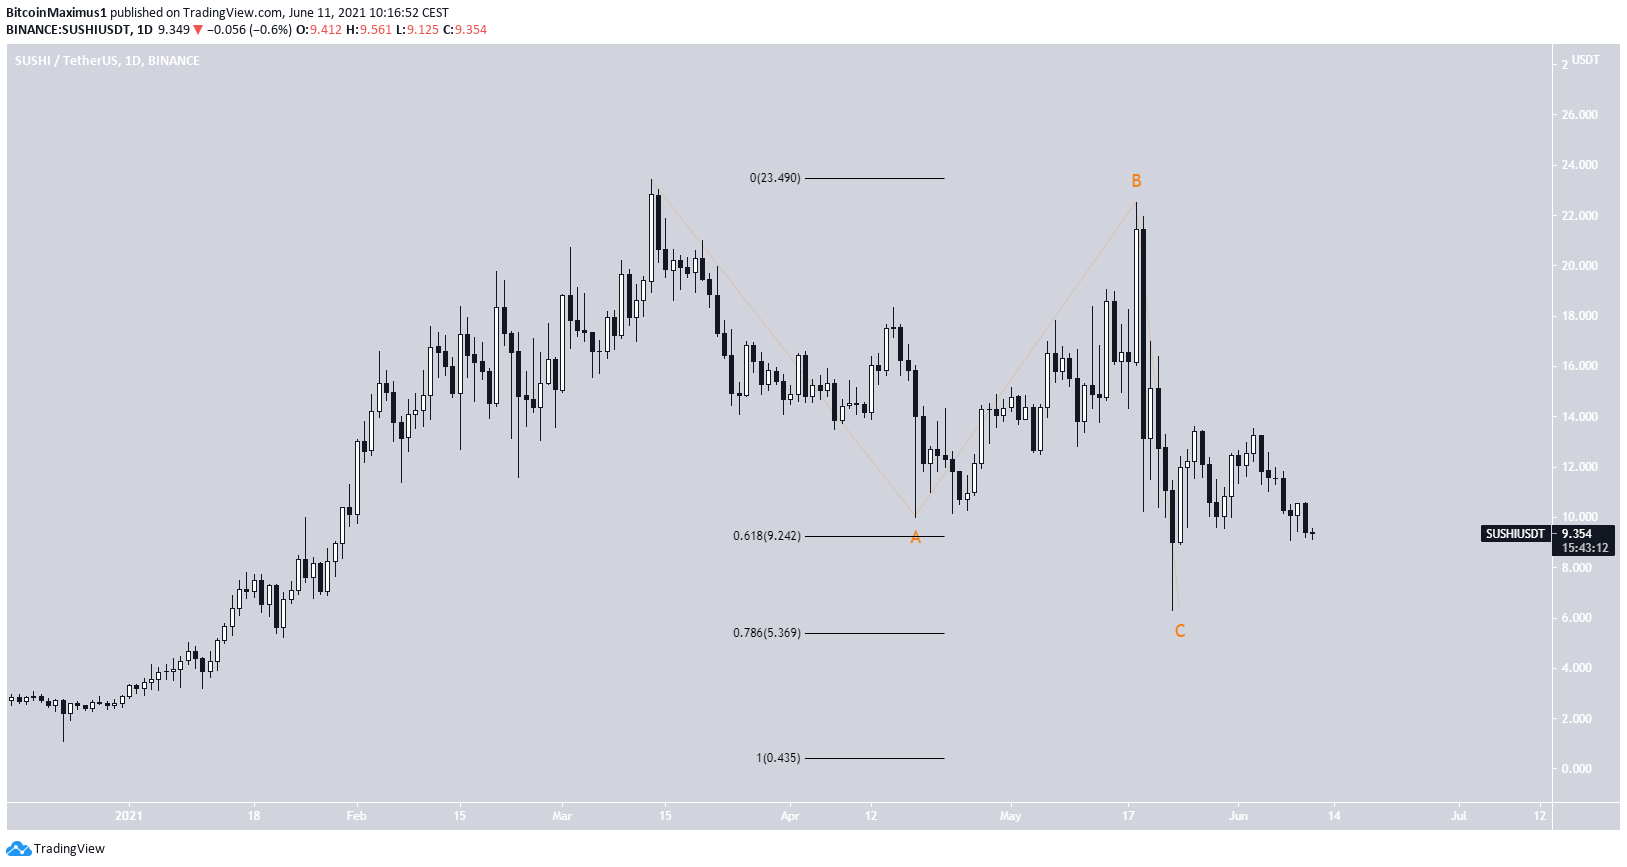
SUSHI has been decreasing gradually since March 13 and at a more accelerated rate since May 18.
On May 23, it reached a low of $6.29 and bounced.
The preceding decrease looks like a completed A-B-C corrective structure, while the bounce looks impulsive. In addition, it reclaimed the $9.24 area, which is the 0.618 Fib retracement support level.
As long as the $6.29 low is not taken out, it’s possible that this is the beginning of a new upward movement.
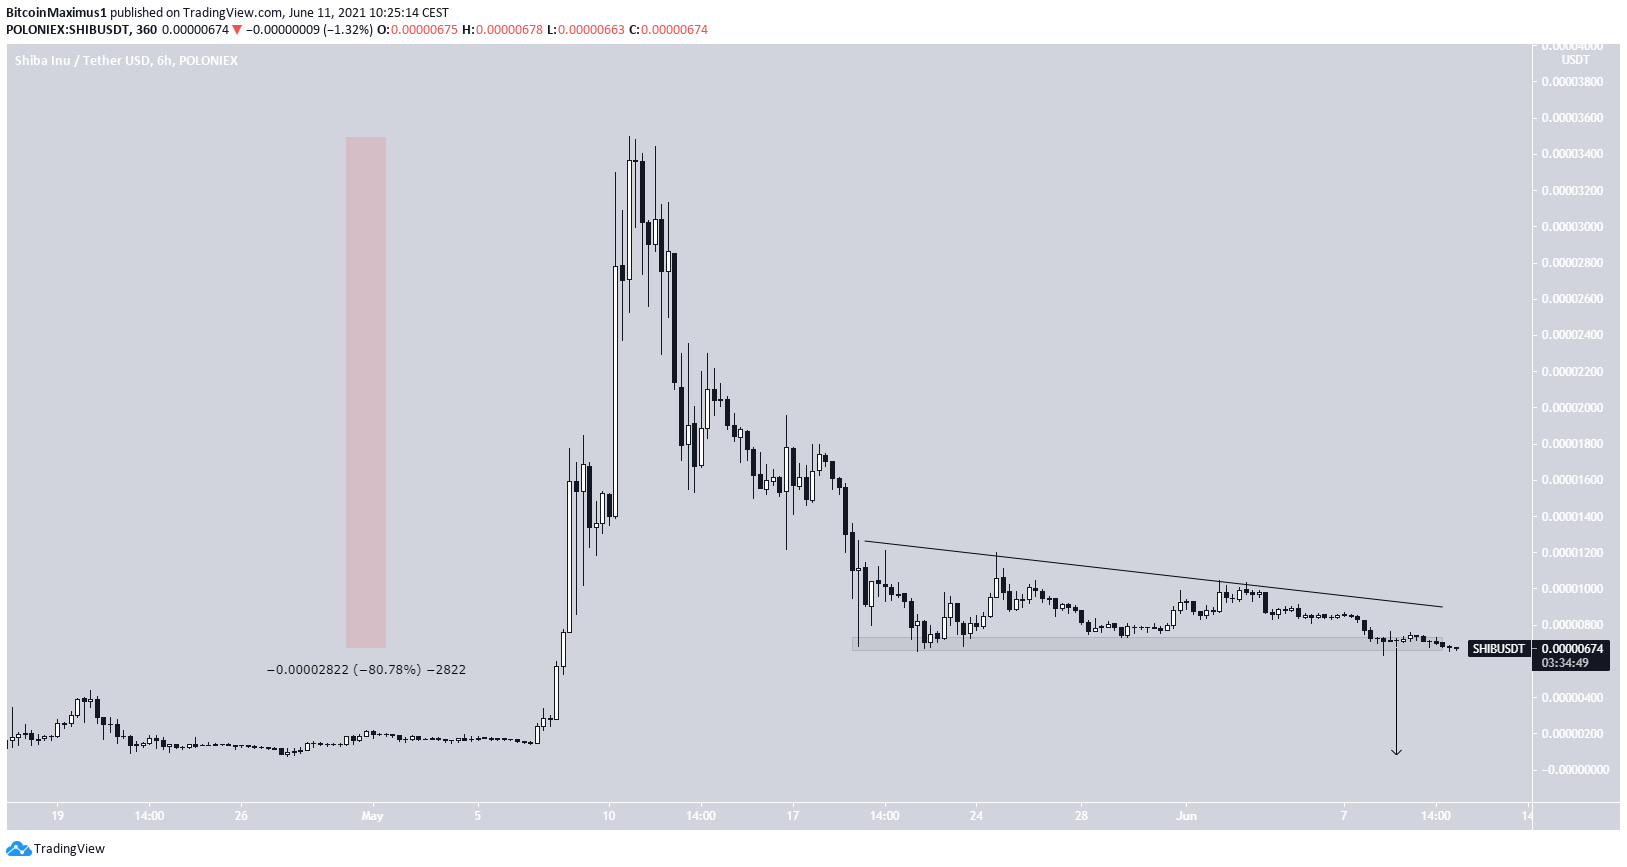
SHIB
In a period from May 10 to May 19, SHIB decreased by a full 80%, culminating with a low of $0.00000680.
The ensuing bounce has been weak and so far has created four lower highs. When combined with the horizontal support area of $0.00000680, it created a descending triangle.
A breakout from the triangle that travels its entire height could take SHIB towards $0.00000100.