The cryptocurrency market has been riding a price rollercoaster as the year draws to a close. The market’s volatility also comes in the wake of price surges that disrupted the bear’s hold on the cryptoverse. Popular cryptocurrencies like Bitcoin [BTC], XRP and Litecoin [LTC] underwent hikes and dips, with the inconsistency also being reflected on the respective positions on the charts.
1 day:
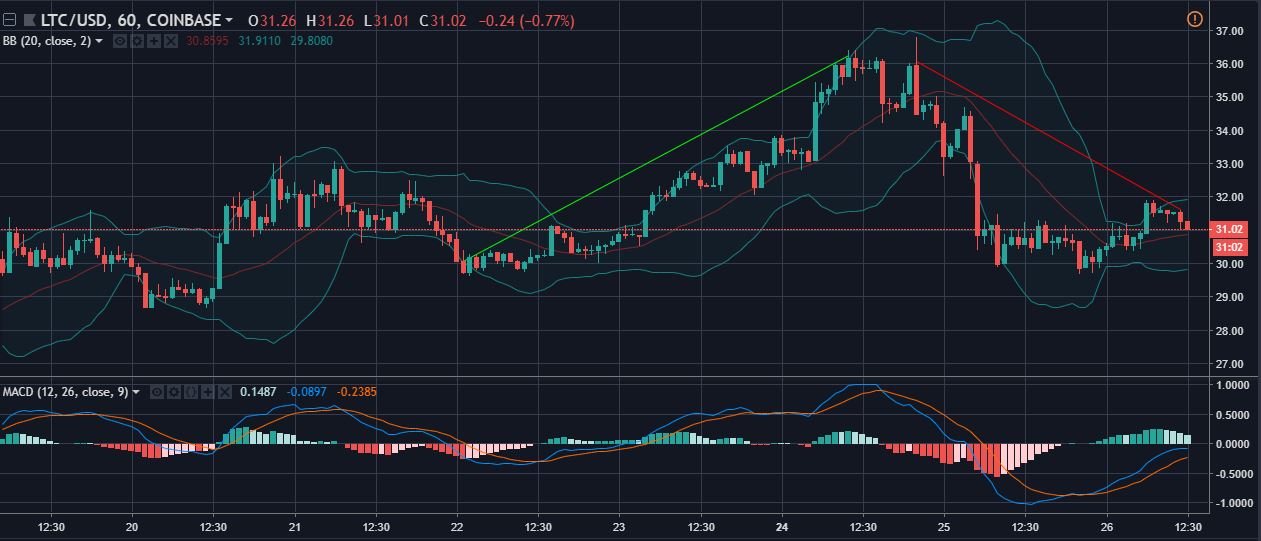
The one-hour graph for Litecoin shows a drastic uptrend and an almost equal downtrend that brought the prices down. The price rise lifted the price from $30.21 to $36.15 while the crash saw the price crash from $35.97 to $31.69. The support has been holding at $28.65 while the resistance is at $36.21.
The Bollinger band shows a slight divergence with the Bollinger cloud remaining small. This is a sign of the prices settling after a bear crash.
The MACD indicator points to the signal line and the MACD line rising up together after a bullish crossover. The MACD histogram has been a sporadic mix of bearish and bullish signals.
1 day:
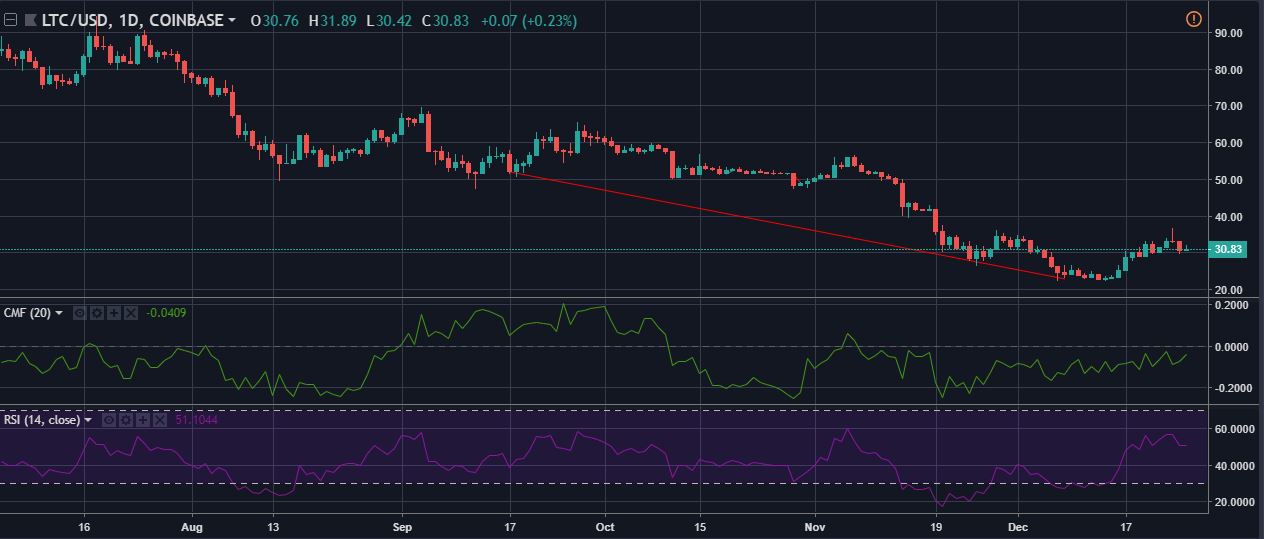
Litecoin’s one-day chart shows a price dip that has been consistent for a long time, the trend being bucked recently due to the bullish surge. The downtrend witnessed the prices fall from $51.89 to $23.31. The long-term support has been holding at $22.50.
The Chaikin Money Flow indicator has been consistently holding below the zero line, giving Litecoin a bearish signal. This is also a sign of the money outflow being higher than the money flowing into the market.
The Relative Strength Index has risen towards the overbought zone after staying below the oversold zone. The spike coincides with the buying pressure being more than the selling pressure.
Conclusion:
Out of the above-mentioned indicators, the CMF has taken the side of the bear while the others voted for the bull’s reign.