Cardano is a public blockchain network that welcomes visionaries, change drivers, and innovators on board, for creating a wide range of decentralized apps and digital assets. It is a PoS-based network and ADA is its native token. As per recent news, Tesla CEO Elon Musk’s tweet that the power of cryptocurrencies should not be harnessed at the cost of the environment led to a plunge in the prices of many cryptos including ADA. The ADA technical analysis is as follows:
Past Performance
On May 7, 2021, ADA started trading at $1.65. On May 13, 2021, ADA closed at $1.93. Thus, in the past week, the ADA price surged by roughly 17%. In the last 24 hours, ADA has traded between $1.87-$1.95.
https://s3.tradingview.com/snapshots/w/weuVGFqg.png
Day-Ahead and Tomorrow
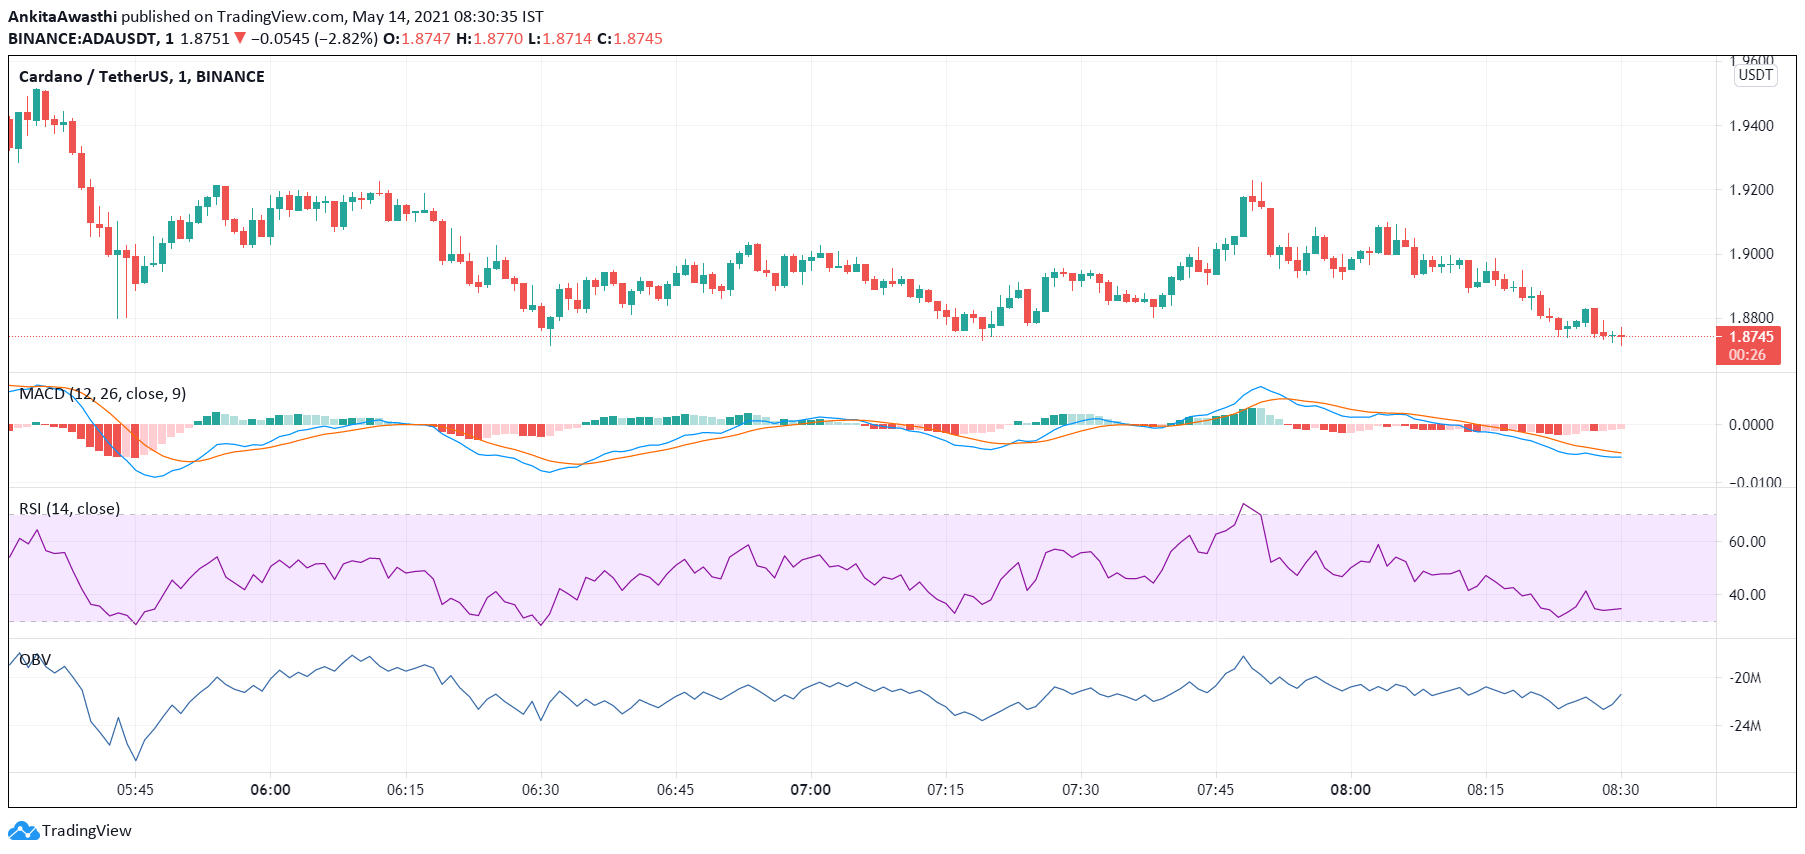
Currently, ADA is trading at $1.87. The price has decreased from the day’s opening price of $1.93. Thus, the market seems to be bearish.
The MACD and signal lines are negative. Moreover, a bearish crossover by the MACD line over the signal line has occurred. Hence, the overall market momentum is bearish. Thus, we can expect the price to decline further.
Currently, the RSI indicator is at 46%. It faced rejection at 35% and rose to this level. This implies that buying pressures are slowly building. Hence, we can expect the price to start rising after some time.
The OBV indicator is also steadily increasing. Hence, buying volumes are slowly surpassing the selling volumes in the ADA market. When we look at the OBV indicator in conjunction with the other two oscillators, we can say that the price may continue to decline for some time. Thereafter, we have to wait and watch if the price starts rising. A bearish trend reversal seems to be on the horizon.
ADA Technical Analysis
The ADA price is currently below the first Fibonacci pivot support level of $1.88. It may soon fall below the subsequent support levels of $1.87 and $1.84, respectively. Thereafter, the price may start rising, if the bulls gain strength.
The price has tested and fallen below the 23.6% FIB retracement level of $1.88. If by day end, the price retests and breaks out of the 76.4% FIB retracement level of $1.93, then the bullish forces have probably become strong. In that case, the price uptrend is likely to continue tomorrow as well.