Corrections in a bull phase are usually a bullish sign as they reduce the frothy excitement and allow stronger hands to enter the markets. However, the recent correction in Bitcoin (BTC) from its all-time high at $64,849.27 does not seem to have scared novice traders.
Data from DappRadar shows that decentralized exchange volumes have picked up in the last week as traders may have exited profitable Bitcoin positions to buy altcoins at their current rock bottom prices.
Another sign of interest in altcoins is the sustained high volumes in Dogecoin (DOGE), which remains the fourth most traded cryptocurrency by volume, behind Bitcoin, Ether (ETH), and XRP, according to data from CoinMarketCap.
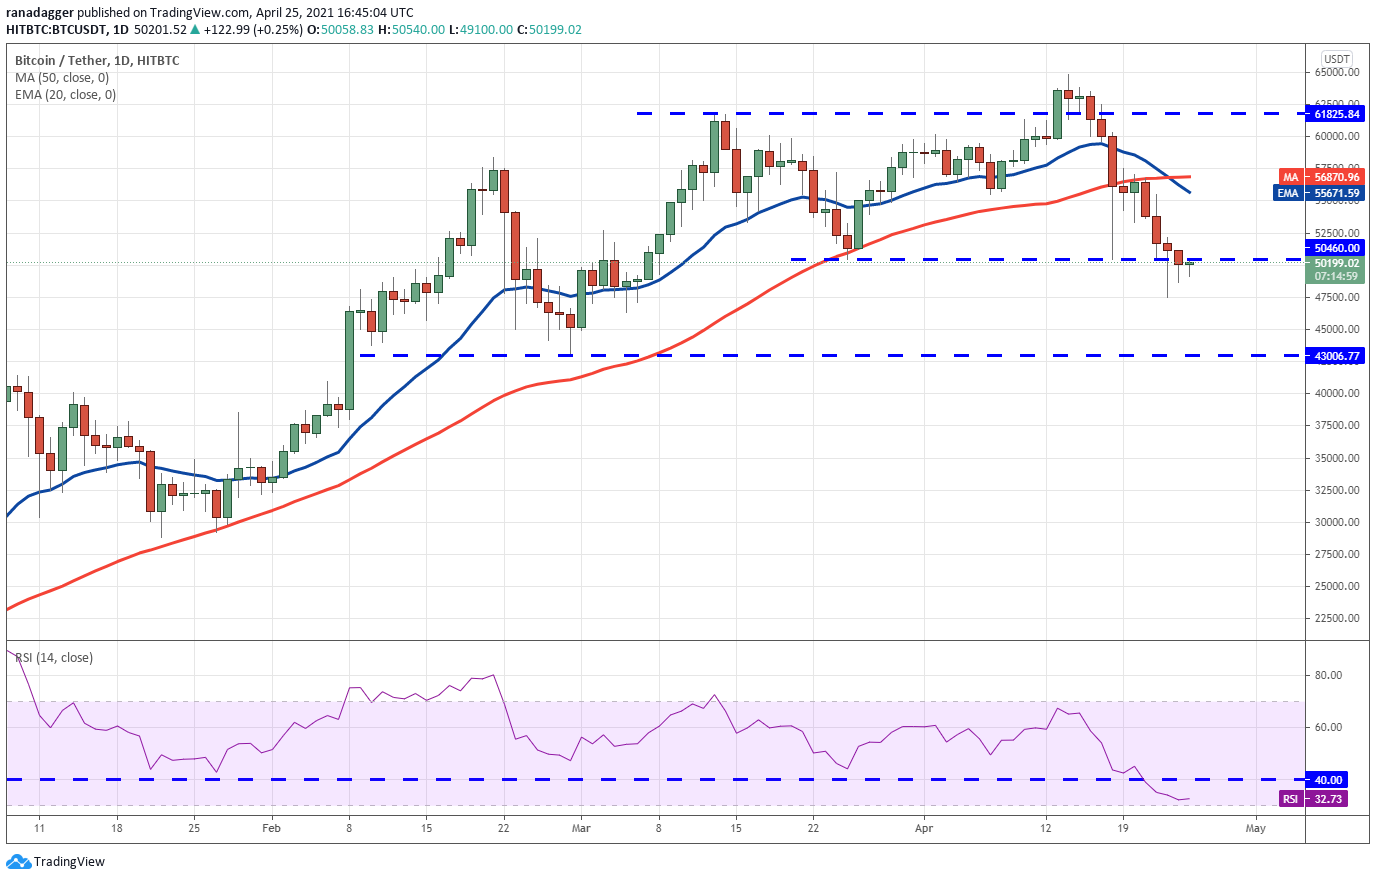
The 20-day exponential moving average ($55,671) is sloping down and the relative strength index (RSI) is close to the oversold territory, suggesting the bears have the upper hand.
The BTC/USDT pair had formed an inside day candlestick pattern on April 24 and today, indicating indecision among the bulls and the bears. If the uncertainty resolves to the downside, the selling could intensify, opening the gates for a decline to $43,006.
On the other hand, if the bulls can push the price above $52,129, the pair could witness a relief rally that is likely to face resistance at the 20-day EMA. If the price turns down from this resistance, the possibility of a break below $47.459 increases.
This negative view will invalidate if the bulls push and sustain the price above the 50-day simple moving average ($56,870).
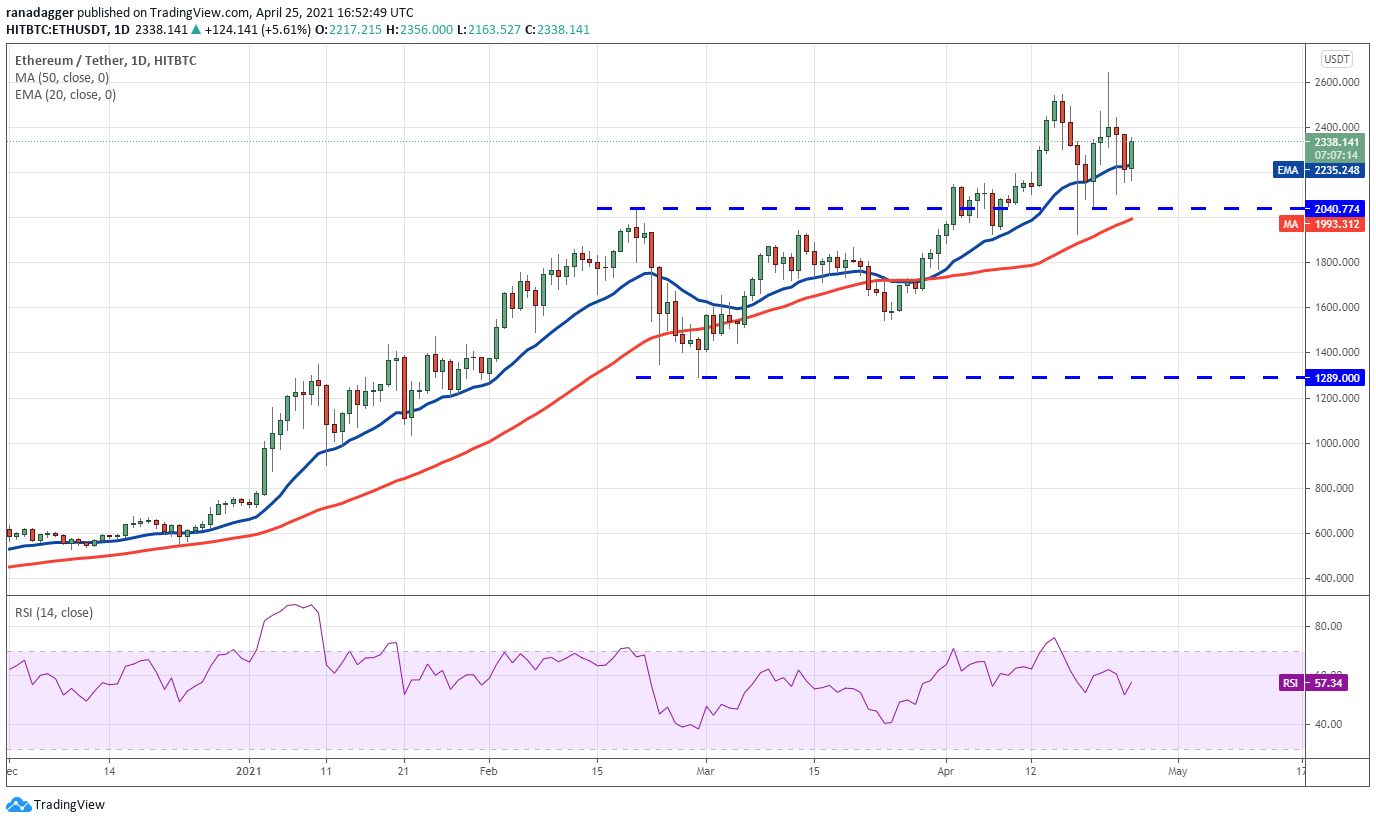
A breakout of the overhead zone could signal the start of the next leg of the uptrend that may extend to $2,745 and then $3,000. The gradually rising moving averages and the RSI above 57 suggest the path of least resistance is to the upside.
Contrary to this assumption, if the price turns down from the overhead resistance, the bears will again try to sink the ETH/USDT pair below the moving averages. If they succeed, the pair may start a deeper correction to $1,542.
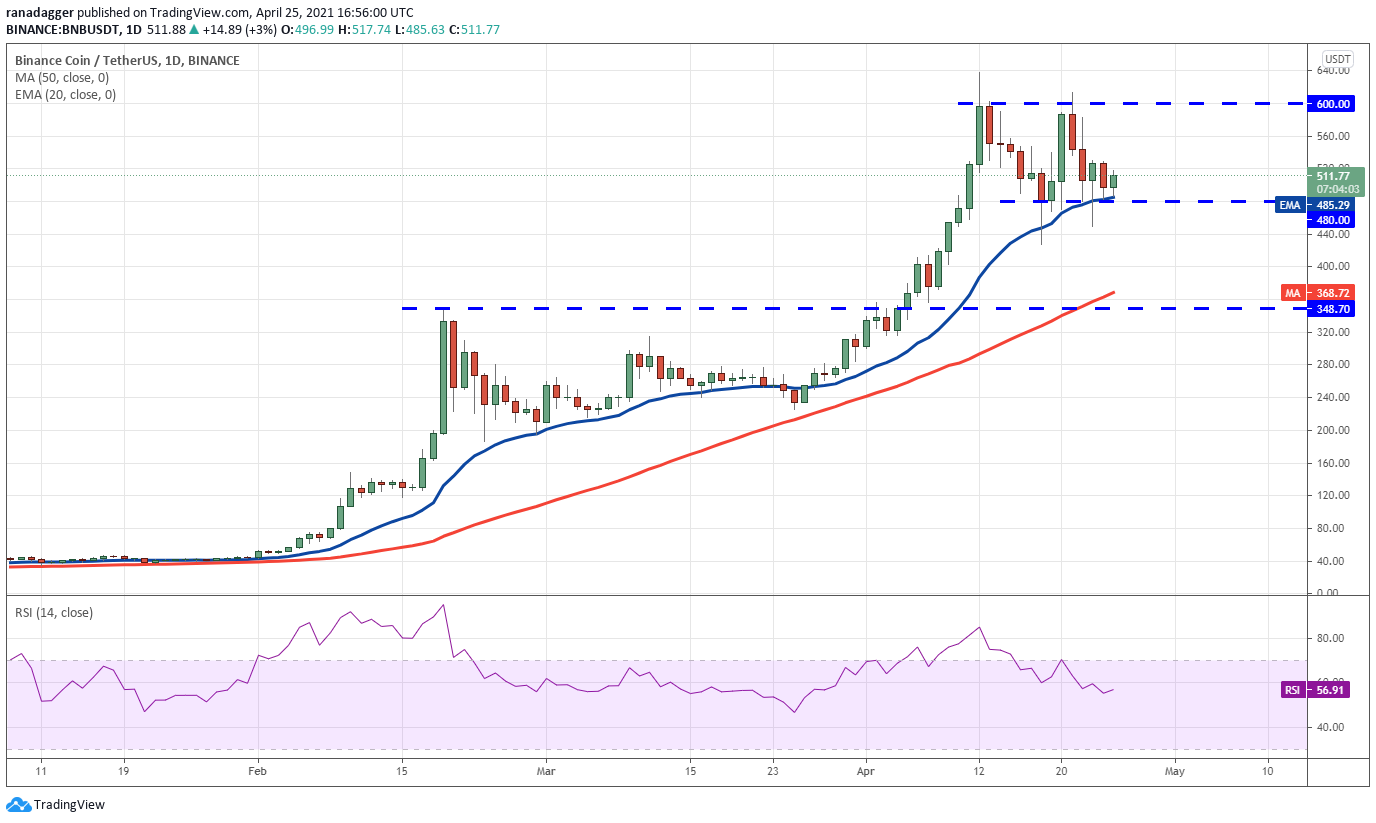
Both moving averages are sloping up and the RSI above 56 suggests that the bulls have the upper hand. If the buyers can push the price above $530, the BNB/USDT pair could start its journey to the resistance of the range at $600. The bears are again likely to mount a stiff resistance between $600 and $638.57.
If the price turns down from this zone, the range-bound action may continue for a few more days. On the contrary, if the bulls push the price above $638.57, the pair could start its journey to $720 and then $832.
This positive view will invalidate if the bears sink and sustain the price below $480. If that happens, the selling may intensify and the pair may drop to the 50-day SMA ($368).
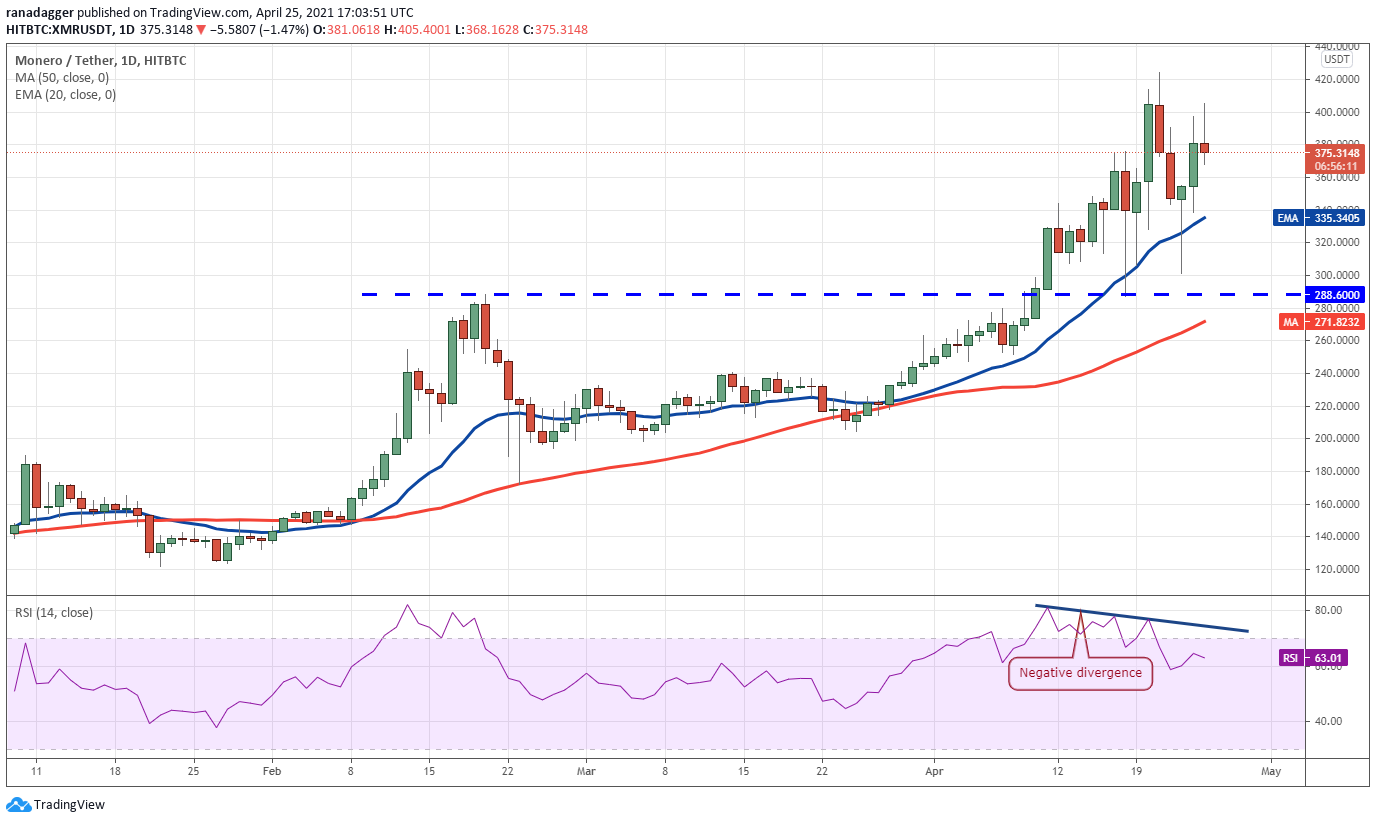
The bulls have successfully defended the 20-day EMA ($335) and both moving averages are sloping up, suggesting the buyers have the upper hand. However, the RSI is showing the first signs of a negative divergence, indicating the momentum may be weakening.
If the price turns down from the current level and breaks below the 20-day EMA, it will suggest the possible start of a correction to $288.60. On the other hand, if the bulls push the price above $424.55, the XMR/USDT pair could rally to $498.
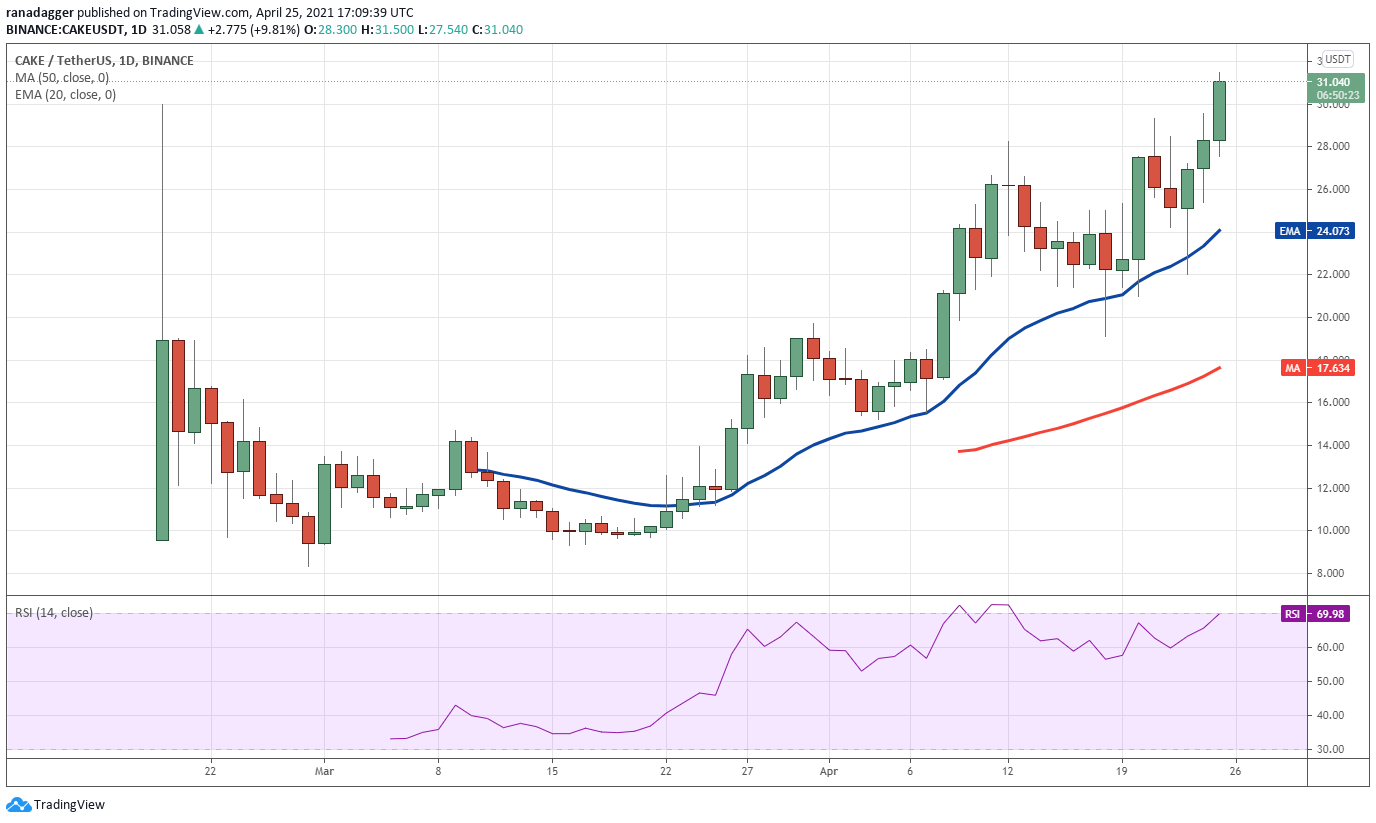
Momentum picked up in the past two days and the CAKE/USDT pair has broken out to a new all-time high today. The upsloping moving averages and the RSI near the overbought zone suggest the path of least resistance is to the upside.
If the bulls sustain the price above $30, the pair could rally to $34.50. This bullish view will invalidate if the bears sink and sustain the price below the 20-day EMA. Such a move will be a significant event as the price has not sustained below the 20-day EMA since March 24.
VORTECS™ data from Cointelegraph Markets Pro began to detect a bullish outlook for CAKE on April 23, just as the rally was getting started.
The VORTECS™ Score, exclusive to Cointelegraph, is an algorithmic comparison of historic and current market conditions derived from a combination of data points including market sentiment, trading volume, recent price movements and Twitter activity.
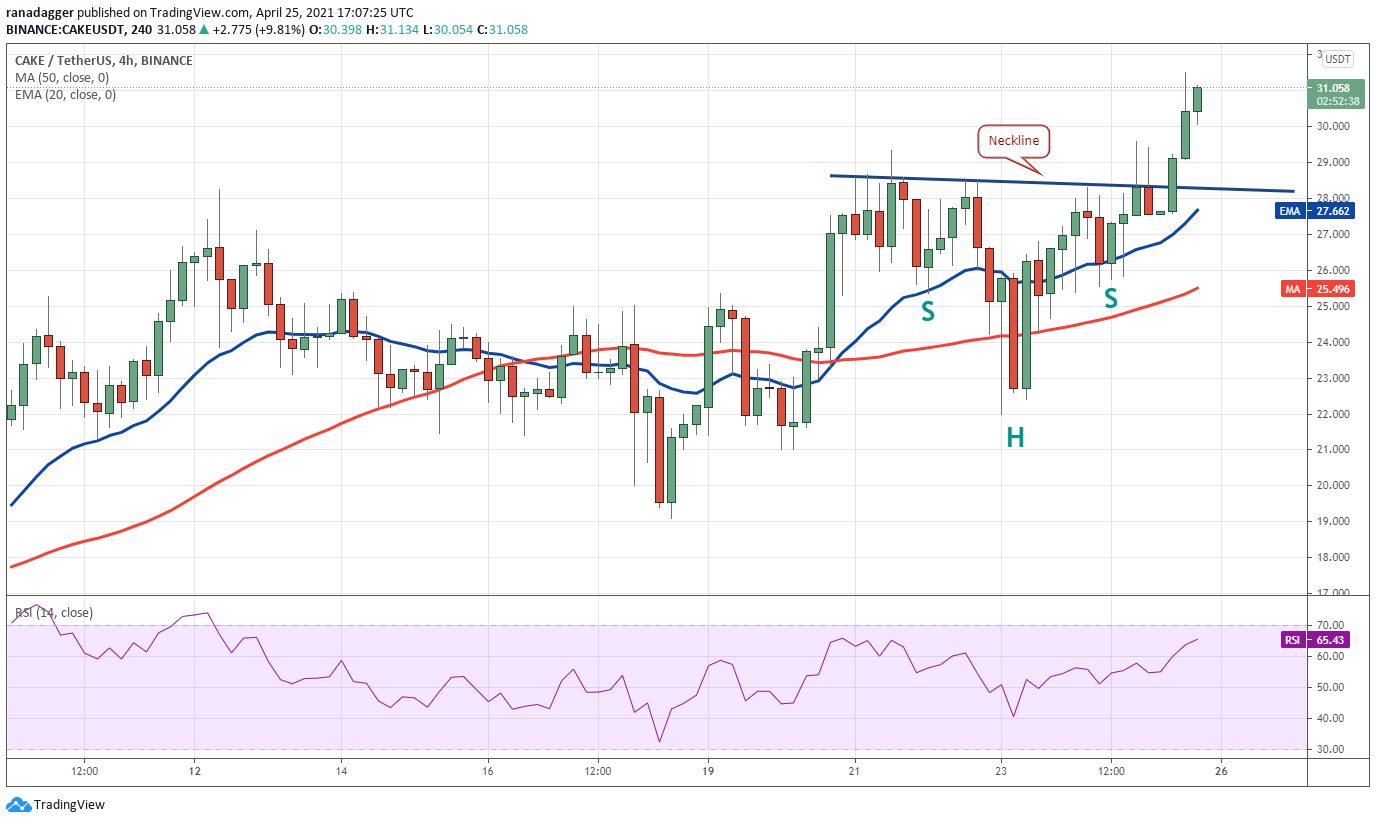
The 4-hour chart shows the formation of an inverse head and shoulders pattern. This bullish setup has a pattern target at $34.70. The 20-EMA has started to turn up and the RSI has risen above 65, indicating the bulls have the upper hand.
In case of a correction, the bulls will try to flip the neckline of the pattern into support. If they do that, the uptrend could resume. Conversely, a break below $27.50 may tilt the advantage in favor of the bears, signaling selling at higher levels
The views and opinions expressed here are solely those of the author and do not necessarily reflect the views of Cointelegraph. Every investment and trading move involves risk, you should conduct your own research when making a decision.