|
|
There are many cryptocurrencies working on similar projects of DeFi like Ethereum. Various network competitors like Avalanche (AVAX), Matic, and Celo are seeing substantial gains as high gas fees push users to search for cheaper alternatives.
Past Performance of AVAX
The opening price of AVAX on February 16, 2021, was $38.16. As of February 22, 2021, AVAX closed at $32.15. The price has fallen by approximately 16% in the past week. Thus, the AVAX price is down swinging.
In the last 24 hours, AVAX was trading between $25.47 and $35.28.
https://www.tradingview.com/x/6AUHGWEw
How AVAX Looks Ahead
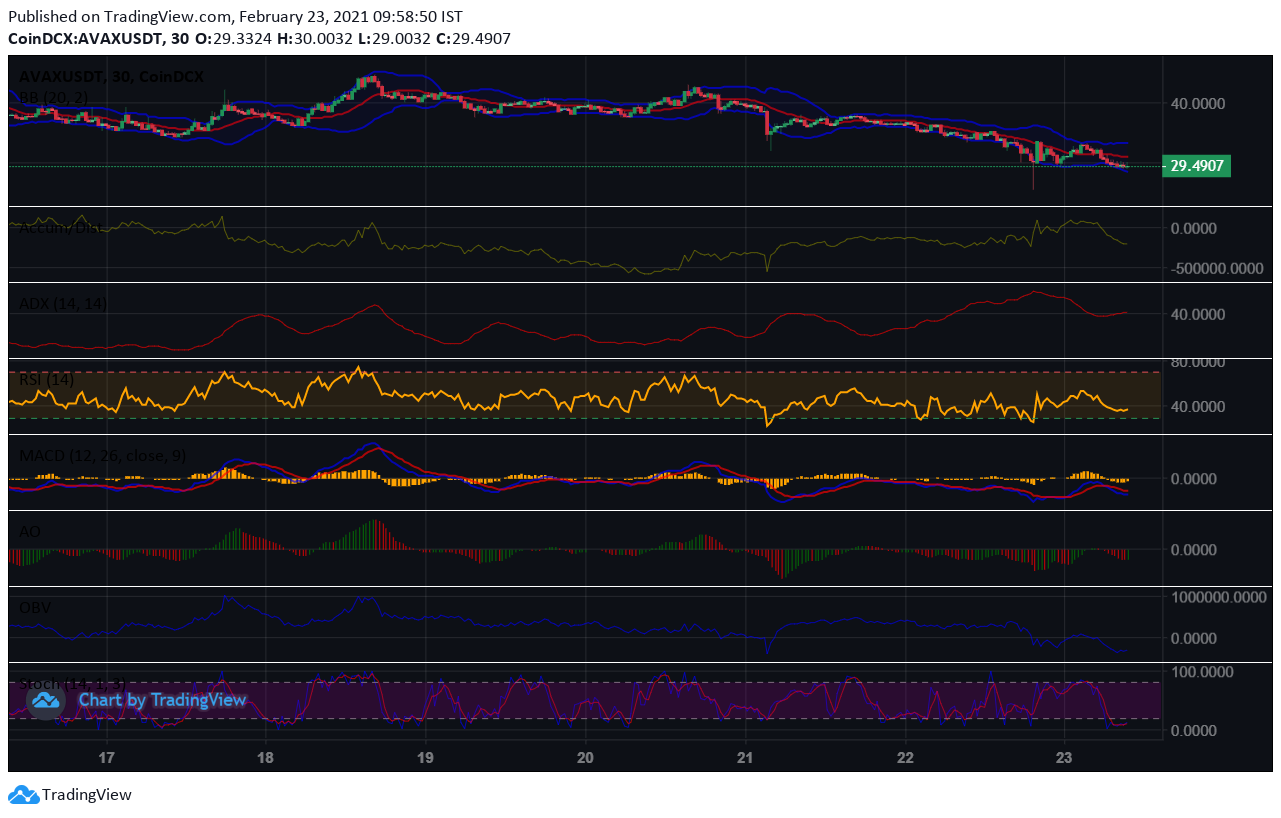
Currently, AVAX is trading at $29.49. The opening price of AVAX was $32.15. Thus, the AVAX price is downtick.
The RSI indicator is currently at 44%. For the past few hours, the RSI was facing a bullish swing rejection at 30%. However, now the indicator has finally started rallying. Thus, selling pressures are high. Gradually, buying activity is picking up. So, we can expect the price to go up.
The MACD and signal lines are negative. The market momentum has been bearish for the past few hours. Both the lines are slowly nearing the zero line. A bullish crossover by the MACD line over the signal line points towards some market price corrections. Both the lines may turn positive soon.
The Stochastic oscillator is in the ‘oversold’ region. A bearish crossover by the actual value-line over the 3-day SMA line indicates bearish market momentum. Selling pressures are still high and hence the price will struggle to go up.
The AO indicator is negative too. But, sell signals are becoming weaker. The AO may turn positive soon. It is a good time for swing traders to go long. A trend reversal may be on the horizon.
Summing Up
However, the OBV line is falling steeply. Thus, selling volumes are much higher than buying volumes. The A/D indicator is downward sloping too. Thus, distributions are more than accumulations. Both the price and ADX indicator are falling. Thus, the price downtrend is very strong.
To sum up, the overall trend is bearish. There may be intermittent price increases as a part of the price discovery process.
The current price is below the Fibonacci pivot point of $30.97. The price is steadily falling towards the first Fibonacci pivot support level of $27.22. By the end of the day, the price may fall below the subsequent support levels of $24.90 and $21.16 respectively.
The price has tested the 38.2% FIB retracement level of $29.22 and fallen below it. It is expected to soon fall below the 23.6% FIB retracement level of $27.78. The price is closer to the lower Bollinger band indicating heavy offloading. Thus, the AVAX bear-run will continue tomorrow as well.