LUNA is one of the cryptocurrencies pushing the DeFi upswing. It remains to be seen if the fundamentals support the technicals. The LUNA price was continually rising till February 10, 2021. However, on February 11, 2021, the price declined by approx. 11%. The closing price of LUNA on February 10, 2021, was $6.09 and it dropped to $5.49 on February 11, 2021.
Past Performance of LUNA
Overall the past week has been bullish. The opening price on February 5, 2021, was $2.66. The price has surged by approx. 106% in the past week.
In the past 24 hours, LUNA has traded between $5.48-$6.52.
https://www.tradingview.com/x/tXCs61fs
Predictions for Day-Ahead and Tomorrow
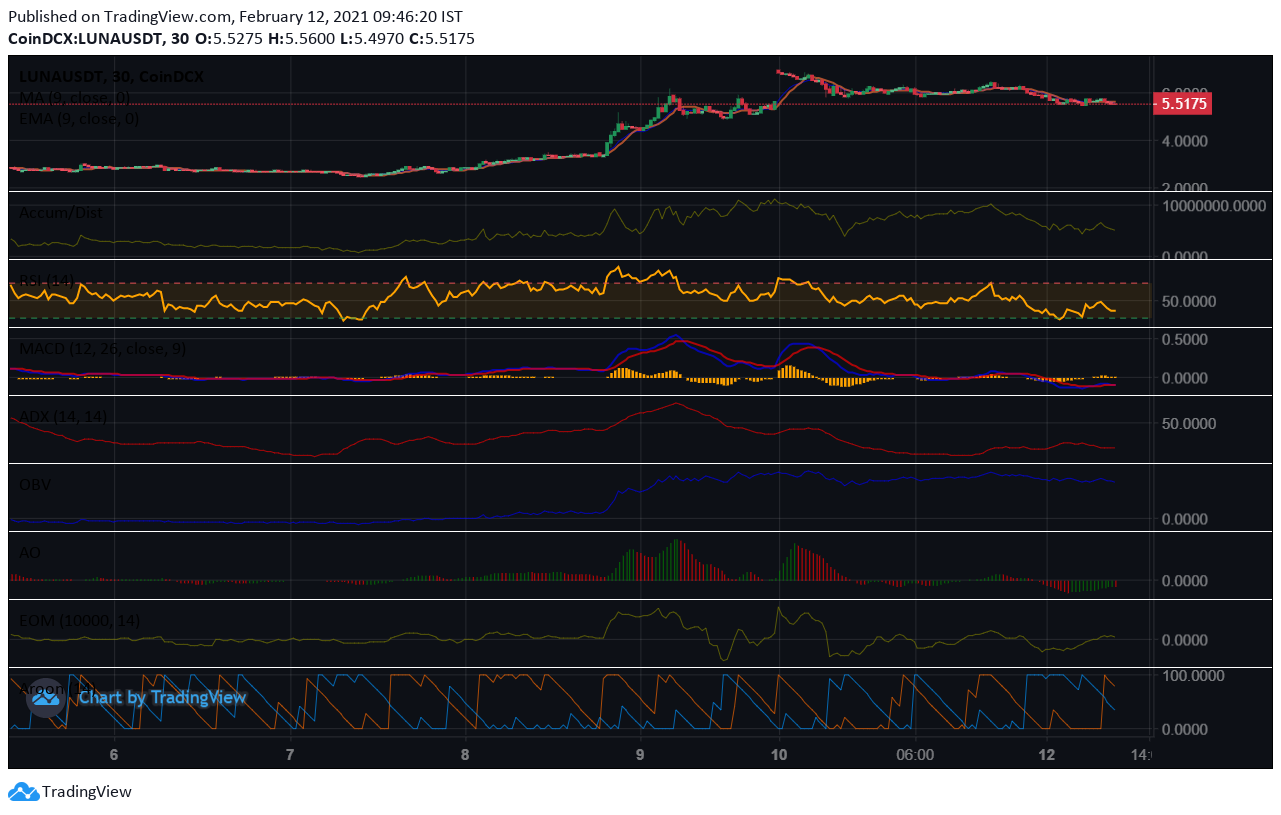
Currently, LUNA is trading at $5.52. It has increased from the opening price of $5.49. However, the price is below the SMA and EMA lines. Hence, we can expect a price pullback.
The A/D line was sloping downwards a few hours back. But, it has started rising steadily. This means whale accumulation has started increasing. However, the OBV line is falling. Thus, selling volumes are higher than buying volumes. The price is also falling. Thus, a price downtrend is likely. The positive divergence shown by the A/D line may lead to a price uptick in some time.
The RSI indicator is at 34%. A few minutes back, the RSI was at 30% and has started rallying. This implies that the crypto is oversold. The selling pressures are still high. It is a good time for swing traders to go long. The price is likely to fall further.
The MACD and signal lines are negative too. A bearish crossover by the MACD line over the signal line gives credence to a price downtrend. Besides, the AO indicator is negative and gives strong ‘sell’ signals. Hence, the price seems to be poised for a bear run.
The Aroon indicator is also showing a bearish trend. The Aroon down line has crossed above the Aroon up line. Hence, the price is likely to decline.
The ADX line is rising indicating that the bearish momentum is strong. The EOM line is falling. This means the price will fall with relative ease.
Currently, the price has fallen below the 23.6% FIB retracement level of $5.66. If it falls below the 23.6% FIB extension level of $5.14, a downtrend is confirmed.
The current price is below the Fibonacci pivot point of $5.80. If it falls below the first and second Fibonacci pivot support levels of $5.37 and $5.11 respectively, then the bear-run will continue tomorrow as well.