ICON (ICX) has broken out from a descending wedge and is expected to move towards the closest resistance area.
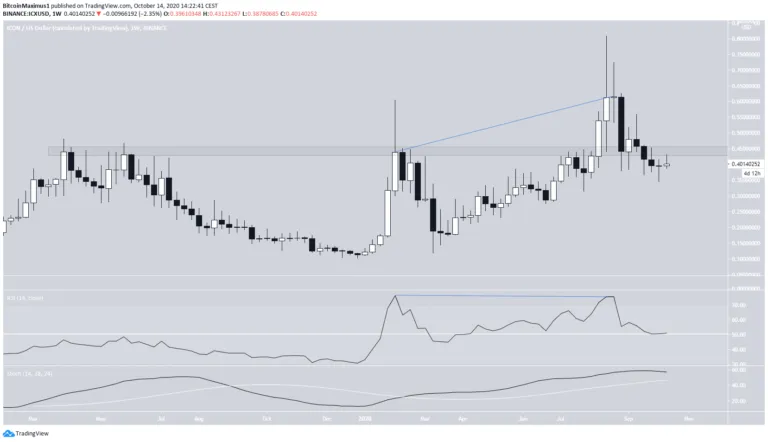
The ICX price has been increasing since December 2019. The increase has transpired through two main upward moves, the second of which caused a breakout above the $0.45 area, which had been providing resistance since March of 2019.
ICX Falls Below Resistance
The price continued to increase until it reached a high of $0.809 on Aug 22. However, the higher prices could not be sustained and ICX created a long upper wick before decreasing considerably. Since then, it has fallen back below the $0.45 area, which is now expected to act as resistance once more.
If the price does not reclaim the area, it would be a major bearish development.
The decrease was preceded by a significant bearish divergence in the weekly RSI. However, the RSI is still trading above 50 and the Stochastic Oscillator is moving upwards, so the outlook is not entirely bearish.
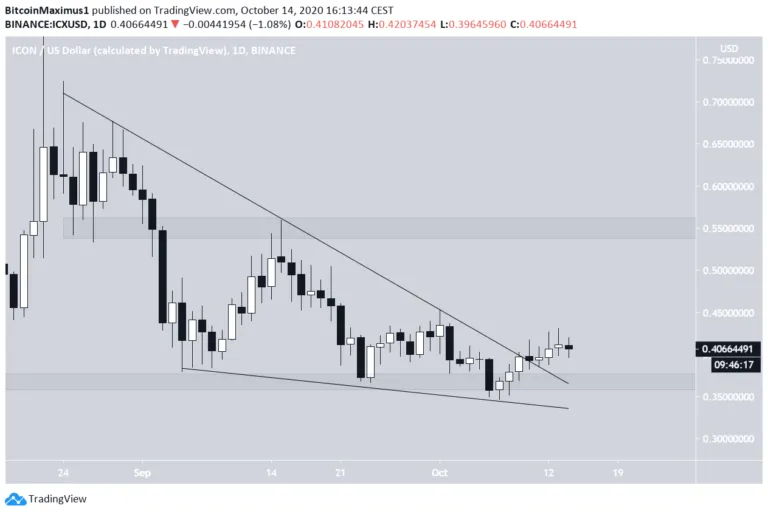
Wedge Breakout
The daily chart shows a breakout from a descending wedge, which had previously been in place since Aug 24.
After the breakout, ICX briefly validated the resistance line and began to move upwards.
If it continues doing so, the closest resistance area would be found at $0.55. This would be above the previously outlined long-term resistance area.
Therefore, the daily chart suggests that the price will reclaim the $0.46 area and continue moving upwards.
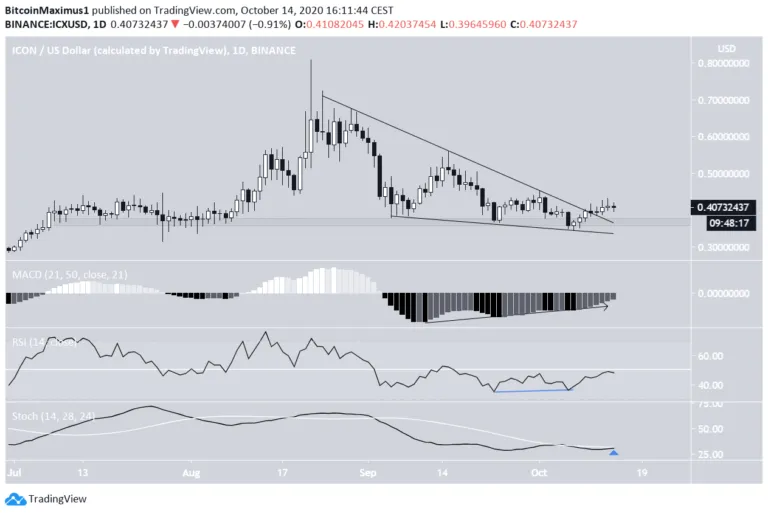
Technical indicators are also bullish. The final two touches prior to the breakout were combined with a bullish divergence in the RSI, which has been moving upwards since.
The MACD has also generated bullish divergence, and the Stochastic Oscillator is in the process of making a bullish cross, supporting the possibility that the price will continue increasing towards the resistance area outlined above.
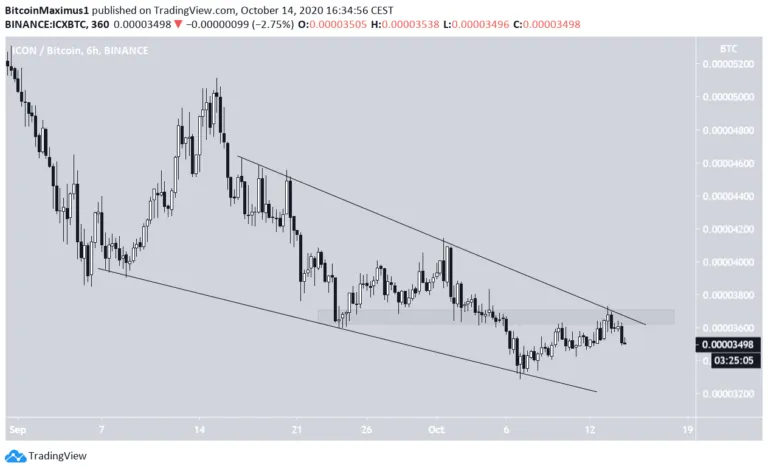
ICX/BTC
Cryptocurrency trader @CryptoNewton outlined an ICX price chart that shows a possible breakout from a descending wedge.
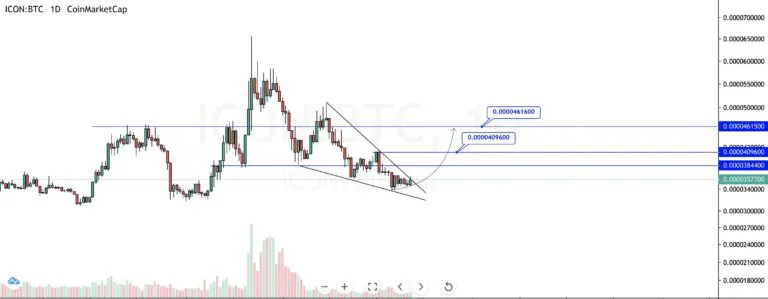
Unlike the ICX/USD pair, the price has yet to break out from the descending wedge. Furthermore, besides the resistance line of the wedge, the price is also facing resistance from the 3,700 satoshi area. Until the price breaks out from both these levels, the trend cannot be considered bullish.
Therefore, the price movement for ICX/BTC is considerably more bearish than that of ICX/USD
Disclaimer: Cryptocurrency trading carries a high level of risk and may not be suitable for all investors. The views expressed in this article do not reflect those of BeInCrypto.