The Litecoin (LTC) price has declined below an important support level but reclaimed it shortly afterward. While rallies in the short/medium-term are expected, it looks as if the price has begun a bearish impulse.
Reclaim of Support
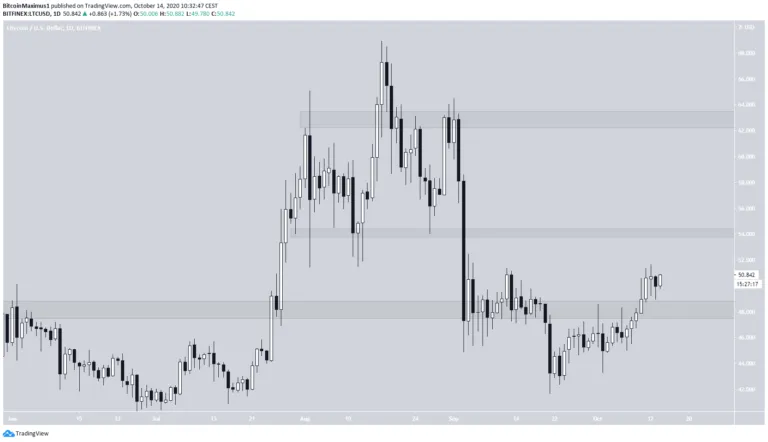
The Litecoin price has been falling since August 17, when the price was trading at $68.94. The price reached a low of $41.66 on Sept 21.
The main support and resistance areas are found at $48 and $64, with a minor resistance level being at $54.
Even though the price initially declined well below the $48 support area, it proceeded to move upwards and reclaim it. As long as the price is trading above $48, it should continue moving upwards towards $54, and possibly $63.
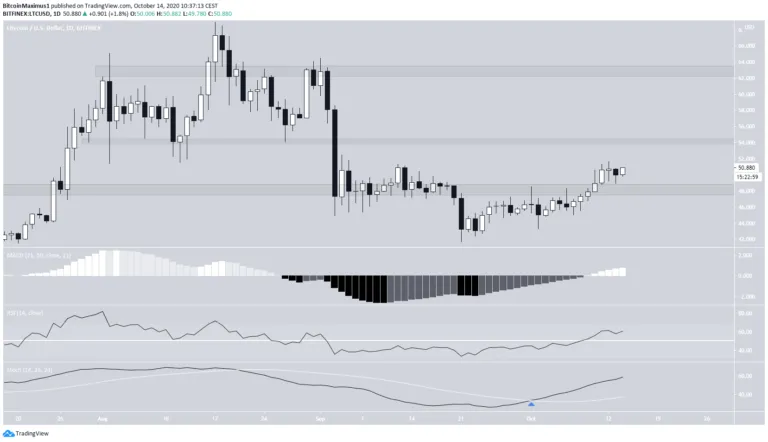
Technical indicators on the daily time-frame are bullish, supporting this proposed rally.
- The MACD is increasing and is in positive territory.
- The RSI is increasing and is above 50.
- The Stochastic Oscillator has made a bullish cross and is moving upwards.
Therefore, the price should rally towards $54 and possibly higher. A look at the lower time-frames is required to determine exactly how it will get there.
Attempt to Move Above Resistance
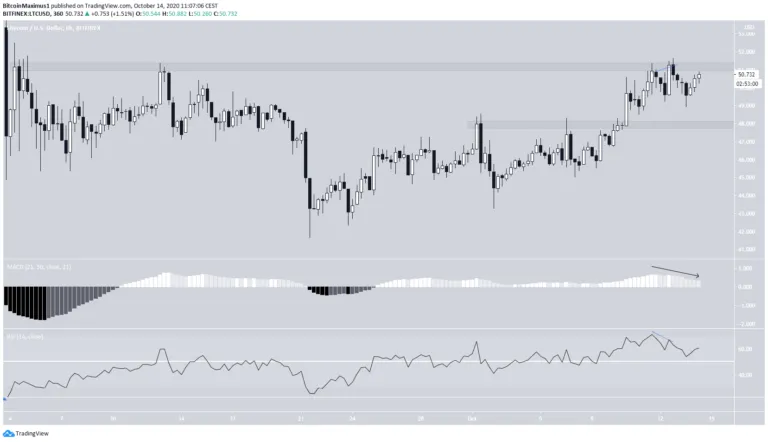
The shorter-term 6-hour chart shows the price attempting to break out above the minor resistance level at $51, above which it has not traded since September 5. This is the third attempt.
However, the MACD is falling and the RSI has formed bearish divergence. This suggests that a decline towards $48 could occur before the price potentially moves upwards.
Besides horizontal levels, there is no clear structure or trading pattern in place,
LTC Wave Count
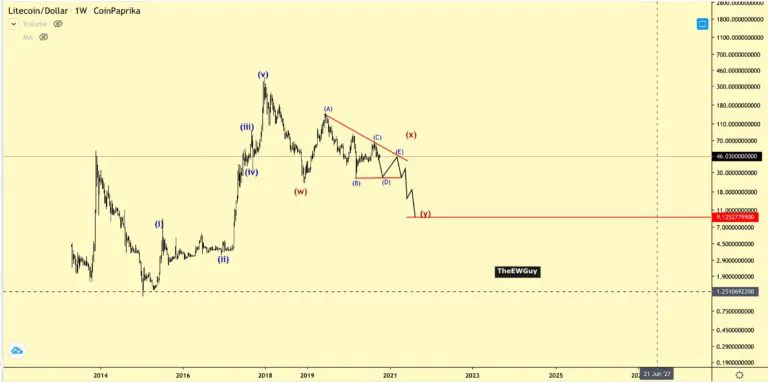
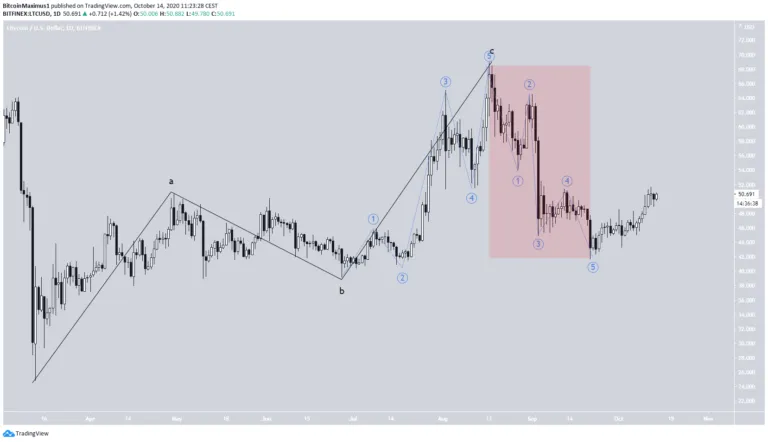
Cryptocurrency trader @TheEWguy outlined an LTC chart, which shows a long-term bearish count that could take the price all the way down to $9.
In BeInCryptos Sept 18 LTC analysis, it was stated that:
“If this is the correct count, the current movement would be some type of sub-wave 4 (in black), after which the price would decrease once more.”
The price did fall once more, reaching the previous low of $41.66 on Sept 21 and completing wave 5 (shown in blue below). While it seems too early to call for a $9 target, it does look as if the price has begun a bearish impulse after the Aug 17 high (highlighted in red).
Prior to doing so, it looks as if LTC completed an A-B-C correction (black), suggestubg the possibility of the beginning of a bearish impulse.
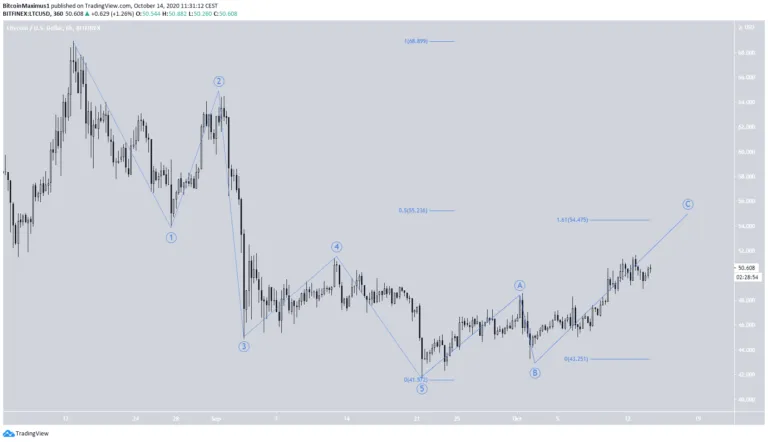
If correct, the price has begun an A-B-C correction (blue), which should end near the previously mentioned minor resistance area at $54.
The $54 area coincides with both the 0.5 Fib retracement level of the entire downward move and the 1.61 Fib length of wave A. Afterwards, a decline seems like the most probable scenario.
To conclude, while the LTC price is expected to rally towards $54 and possibly slightly higher, it’s likely that the long-term trend is bearish.
Disclaimer: Cryptocurrency trading carries a high level of risk and may not be suitable for all investors. The views expressed in this article do not reflect those of BeInCrypto.