Key takeaways
-
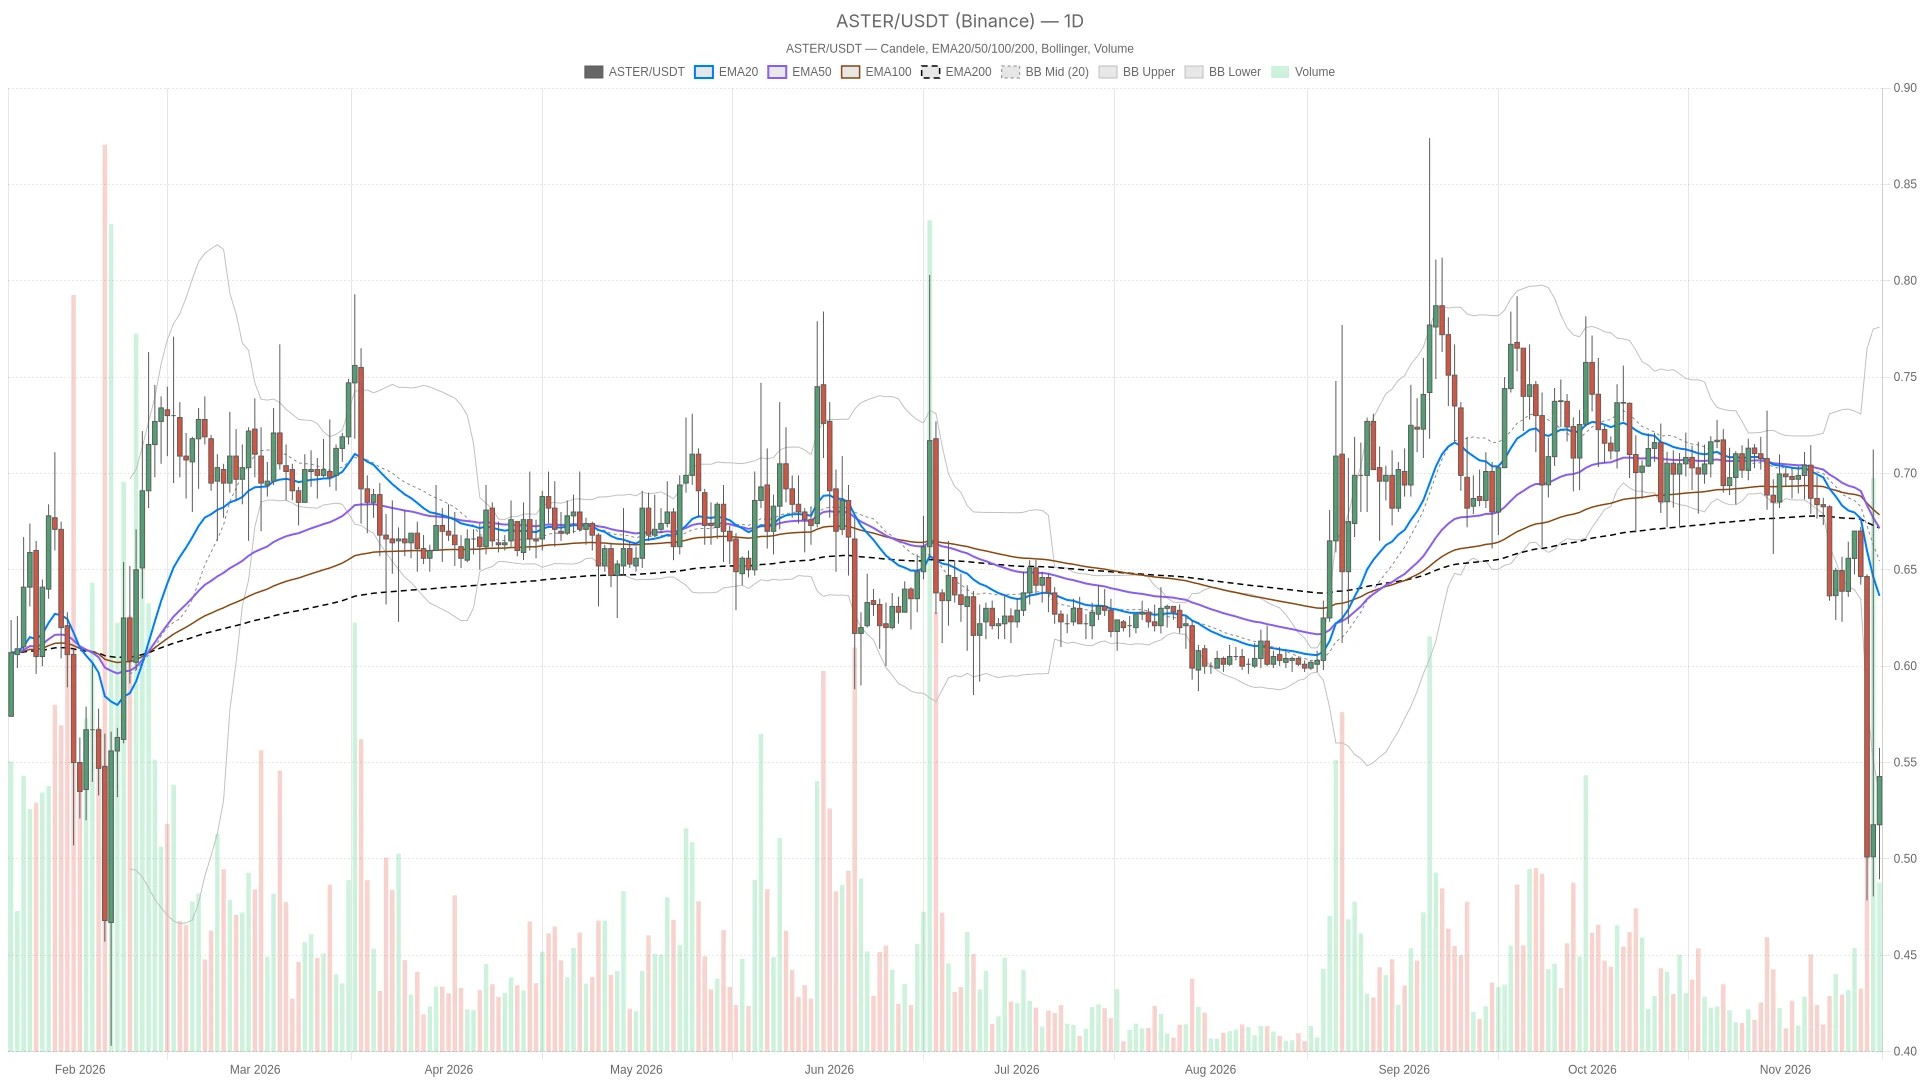
$ASTER trades at $0.5427 with daily RSI at 24.9, deeply oversold but unsupported by momentum
- Daily MACD histogram is negative and widening, reinforcing the bearish bias despite oversold conditions
- Price sits below all daily EMAs and outside the daily Bollinger lower boundary
- An hourly close above $0.5445 would trigger a recovery scenario; a close below $0.5412 would renew downside risk
- Fear & Greed Index reading in the Extreme Fear zone signals a defensive broader market
Aster price scenarios hinge on the hourly pivot and nearby support
The next directional move depends on whether price closes above the hourly pivot at $0.5445 or below the hourly EMA20 at $0.5412.
Bullish scenario: An hourly close above the hourly pivot at $0.5445 would trigger a recovery scenario toward hourly R1 at $0.5491, followed by the daily Bollinger lower boundary at $0.5510. The daily pivot at $0.5702 is the next broader recovery reference. An hourly close below the hourly EMA20 at $0.5412 would invalidate this short-term bullish setup. Even if triggered, this would initially be a countertrend recovery rather than confirmation that the daily bearish bias has ended.
Bearish scenario: An hourly close below the hourly EMA20 at $0.5412 would trigger renewed downside risk toward the hourly Bollinger midpoint at $0.5402 and hourly S1 at $0.5391. Beyond those references, the hourly Bollinger lower boundary sits at $0.4927. An hourly close above the hourly pivot at $0.5445 would invalidate this immediate continuation setup. The last completed hourly candle closed at $0.5436, so neither trigger has been satisfied.
Consequently, the likeliest false signal is a brief push through the hourly pivot that fails before the next resistance. The nearby levels are tightly spaced relative to the reported trading ranges, making an intrahour breach less persuasive than a completed candle. An isolated dip beneath support would not by itself establish sustained downside follow-through.
Oversold daily RSI conflicts with fading hourly MACD strength
The indicators do not currently align in favor of a sustained rebound, as oversold daily conditions clash with weakening shorter-term momentum.
Daily RSI is 24.9, firmly oversold, but its latest completed readings are mixed rather than consistently rising. Hourly RSI is 50.1, offering little directional conviction, while 15-minute RSI has fallen to 48.7. Taken together, these readings leave room for a rebound without showing synchronized upside momentum. The daily market is stretched, but shorter timeframes are not decisively turning that stretch into strength.
Moreover, MACD makes the conflict sharper. The daily histogram is negative and widening, meaning bearish momentum is intensifying despite the oversold RSI. The hourly histogram remains positive but is narrowing, so the recovery impulse is losing strength. On the 15-minute chart, the histogram is negative and flat. For execution context, the shortest timeframe offers no positive momentum confirmation of an hourly breakout.
Price remains below the daily bands and all daily EMAs
The broader structure remains bearish, with $ASTER trading outside the daily Bollinger lower boundary and beneath every daily moving average.
Binance candle data place price beneath the daily Bollinger lower boundary, with the daily midpoint at $0.6630 and upper boundary at $0.7750. Trading outside the lower band highlights downside extension, not an automatic reversal. A return inside the band would improve the mean-reversion case, but the distance to its midpoint shows how much repair the broader structure still needs.
Furthermore, the daily EMA20 is $0.6463, the daily EMA50 is $0.6770, and the daily EMA200 is $0.6730. Price is below all three, although the averages themselves are not aligned. That distinction matters: the bearish directional reading comes from price location and momentum, not a textbook bearish daily EMA stack.
On the hourly chart, price is above the hourly EMA20 but below the hourly EMA50 at $0.5577 and hourly EMA200 at $0.6173; those averages are bearishly aligned. On the 15-minute chart, price is below the EMA20 at $0.5452, above the EMA50 at $0.5417, and below the EMA200 at $0.5572, with the averages not aligned. The hourly recovery therefore remains contained within a bearish structure, while the execution chart is indecisive.
In addition, daily ATR is $0.05163, hourly ATR is $0.02187, and 15-minute ATR is $0.007355. These ranges reinforce the uncertainty around closely spaced hourly levels: crossing a nearby threshold can be ordinary fluctuation rather than evidence that the broader trend has changed.
A sharp reported decline adds context, not proof of a cause
The 32% drop provides market context for the current fragile price action but does not establish manipulation or a specific catalyst.
$ASTER fell 32% as its CEO examined price swings. That context warrants caution about treating the technical rebound as orderly stabilization, but it does not establish what caused the decline or prove manipulation. The chart can identify recovery thresholds; it cannot settle that question.
Extreme fear frames a defensive market backdrop
Sentiment readings confirm a defensive environment, with the Fear & Greed Index at extreme levels, though this alone does not dictate $ASTER’s next move.
Alternative.me’s Fear & Greed Index is classified as Extreme Fear. CoinGecko puts total crypto market capitalization at $2,179,499,129,695.72 and Bitcoin dominance at 59.27%. The sentiment reading adds a defensive backdrop to $ASTER’s fragile recovery, without independently confirming either directional scenario.
FAQ
Does oversold RSI make $ASTER bullish?
No. The daily RSI is oversold at 24.9, but the negative, widening daily MACD histogram conflicts with a reversal thesis. Oversold conditions alone do not confirm a bottom.
Which timeframe defines the main bias?
The daily chart defines the bearish directional bias. The hourly chart tests whether a countertrend recovery can develop, while the 15-minute chart provides execution context rather than overriding the daily structure.
What happens if $ASTER closes below the hourly EMA20?
An hourly close below $0.5412 would trigger renewed downside risk toward the hourly Bollinger midpoint at $0.5402 and hourly S1 at $0.5391, with the hourly Bollinger lower boundary at $0.4927 as a deeper reference.
Disclaimer: This article is for informational purposes only and does not constitute financial advice, an investment recommendation, or a solicitation to buy or sell any financial instrument or cryptocurrency. The analysis provided is not indicative of future results. Investing in crypto assets and financial markets carries a high risk of capital loss. Always do your own research (DYOR) and consult a qualified financial advisor before making any decision.
Article produced with the assistance of artificial intelligence and reviewed by the editorial team.

 en.cryptonomist.ch