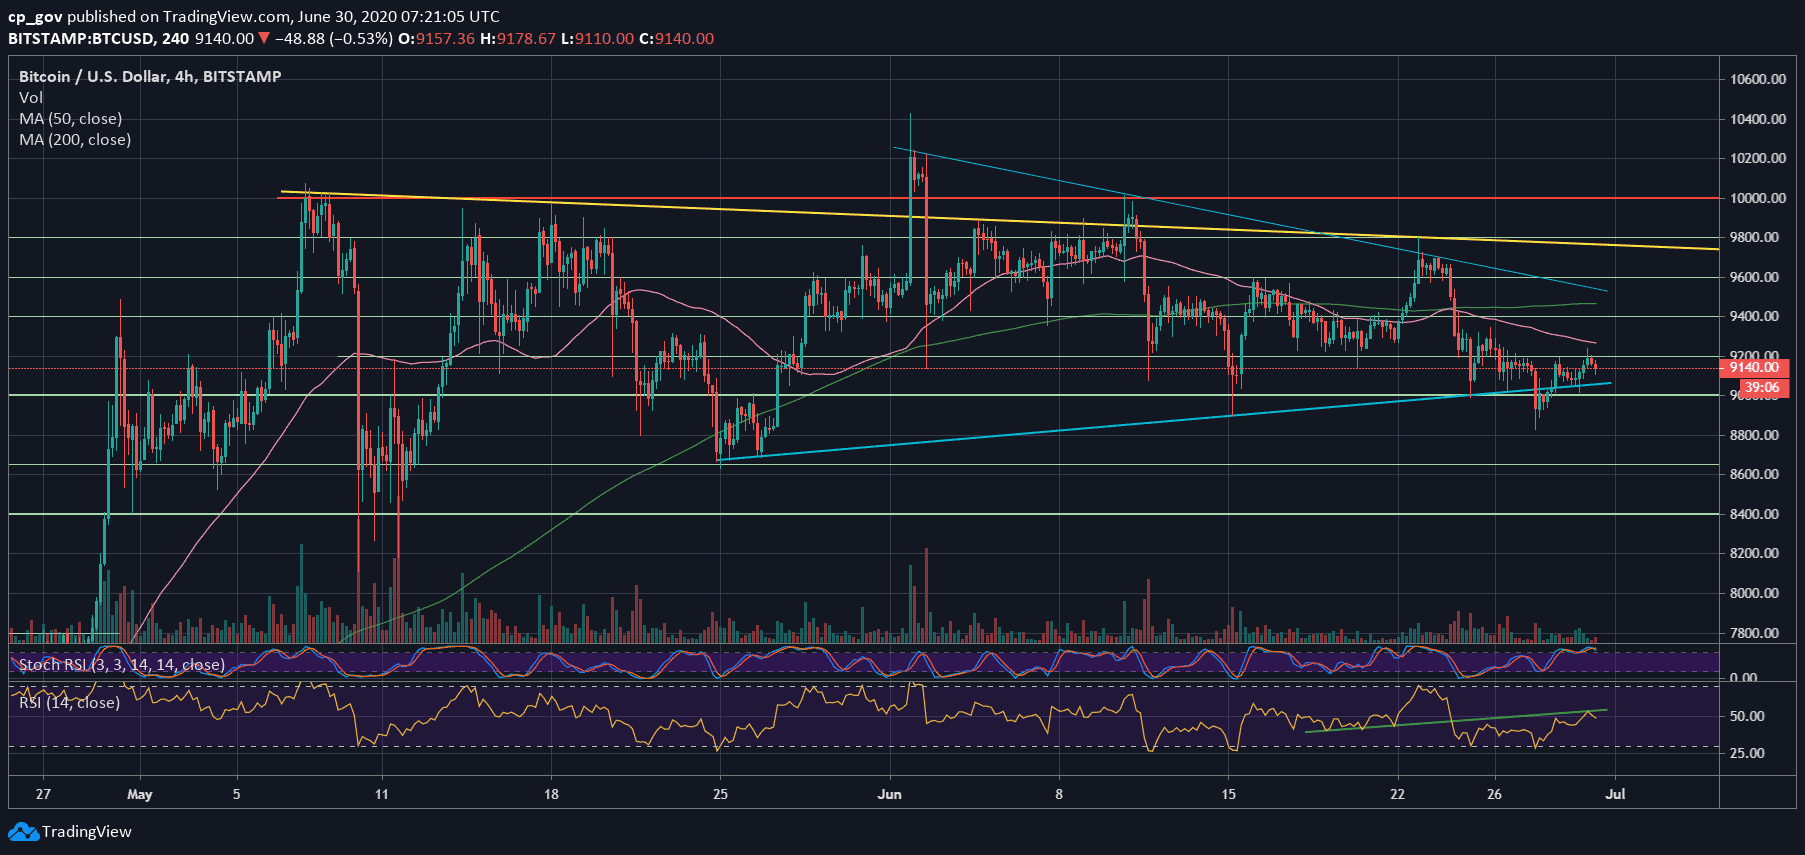
During the past two days, the Bitcoin price was trading under a tight range between $9000 and $9200.
This untypical stability by Bitcoin is just showing how indecisive the primary cryptocurrency is. What is for sure is that a wild price move is likely to take place over the next few days.
Following the Saturday’s price plunge, reaching out to a new 30-days low, we expected a price pullback. On our recent price analysis, we predicted such pull-back, telling by the oversold RSI levels and the declining number of sellers.
The pull-back reached approximately $9200, which was more than $400 correction since Saturday’s low. Not surprisingly, the $9200 is also the 38.2% Fib retracement level of the past week’s drop.
This level now becomes the most critical level to watch for the short-term of Bitcoin.
Price Levels To Watch In The Short-term
In case Bitcoin fails here, and can’t break above the $9200 level, the first level of support is likely the $9000 benchmark. This is followed by $8830, which is the 30-days lowest price, that was reached on Saturday.
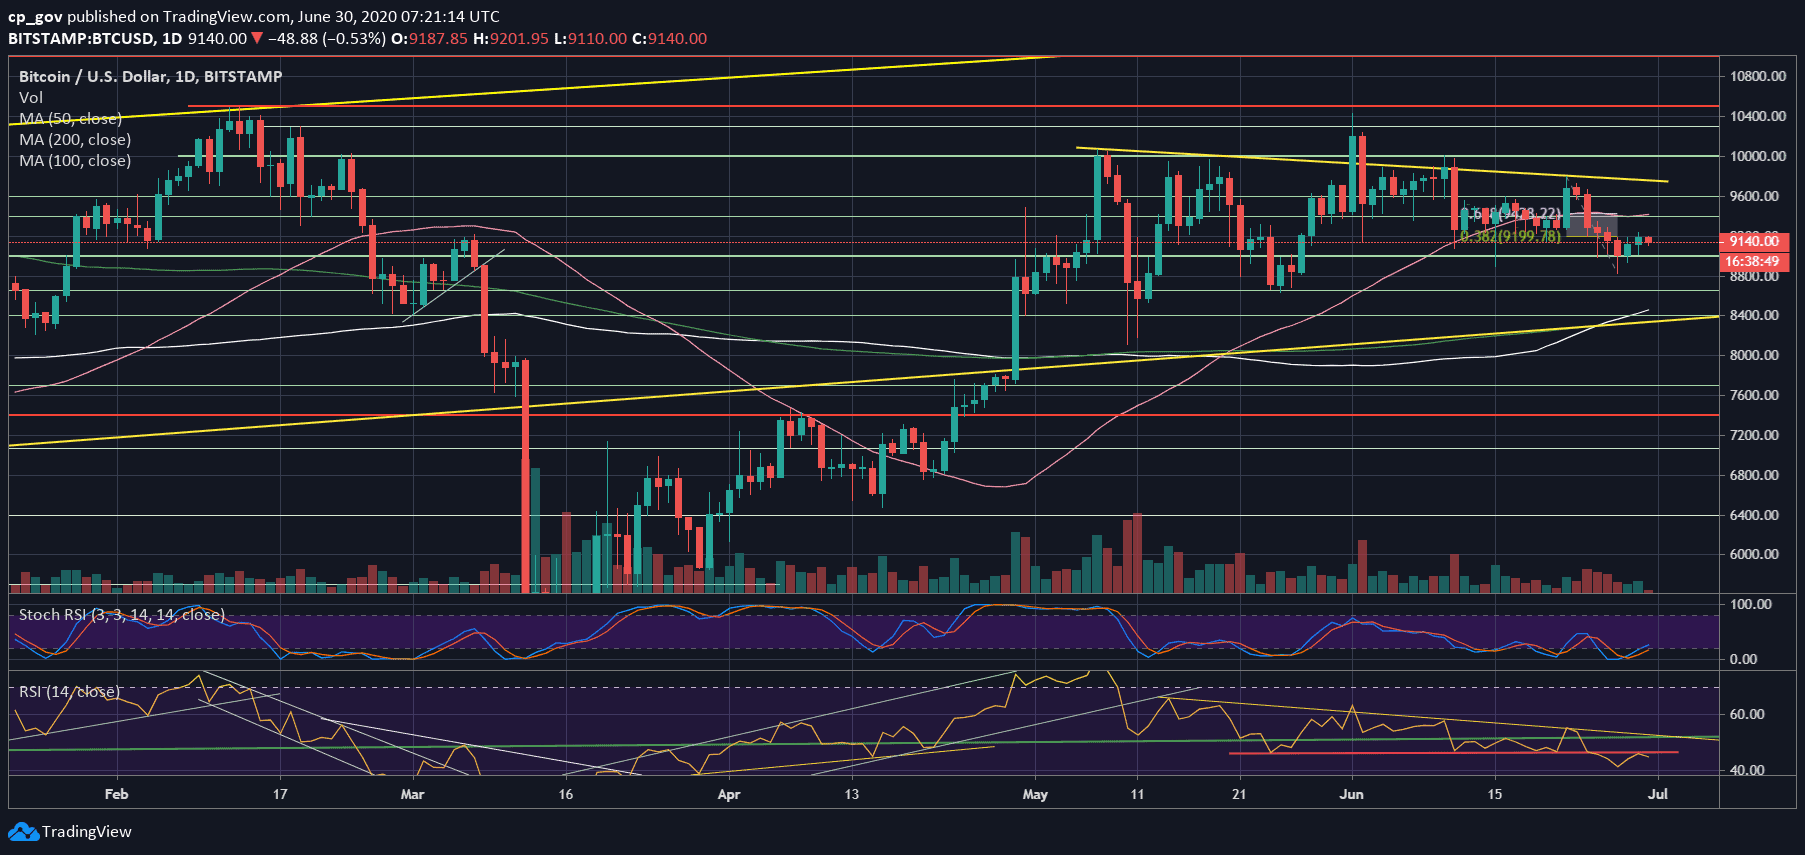
Further below lies $8650, before the most significant support level at $8300 – $8400. The latter contains a long-term yellow ascending trend-line (on the daily chart) and both the 100 and the significant 200 days moving average lines.
From above, in case that Bitcoin does succeed in breaking up $9200, then the next resistance to watch is $9400, which is also the Golden Fib level and the 50-days moving average line (marked pink on the following chart). Further above lies $9600.
The Technicals
Looking at the daily RSI indicator, we can see a classic bearish pattern. The 46 level (marked by a red line on the bottom of the daily chart) served as support over the past ten days and got broken down during Saturday’s price plunge.
The correction of yesterday precisely reached the line, but from the other side, just to confirm it as support turned resistance level. This is a bearish sign. It will be invalidated only when producing a higher low above the 46 RSI level.
The trading volume is still very low. This is another sign of an upcoming move, and the indecisive stage of the Bitcoin market.
Total Market Cap: $260 billion
Bitcoin Market Cap: $168 billion
BTC Dominance Index: 64.7%
*Data by CoinGecko
BTC/USD BitStamp 4-Hour Chart
BTC/USD BitStamp 1-Day Chart