XRP Bollinger Bands Have Become Their Tightest Since Before the August Rally to $1.7
thecryptobasic.com
6 h
$XRP Bollinger Bands have narrowed to their lowest levels since mid-August 2026, before the crypto asset recorded its last major rally toward $1.70.
This comes as $XRP continues to trade sideways following the recent market-wide selloff. However, the drop in volatility has led to expectations that the token could be approaching another major price movement.
$XRP Struggling to Recover After Binance Hack
$XRP remains under pressure following the market-wide selloff triggered by the Binance hack, which reportedly resulted in losses of $6.3 billion from the exchange. During the incident, hackers moved nearly $300 million worth of $XRP from Binance.
Know when your coins move
Alerts, real-time prices, and market news — all in one app
Point your phone camera to install
4.8 based on 40K reviews in the App Store and Google Play
The exploit had an immediate effect on$XRP, sending its price down 6.64% on the day.Since then, $XRP has struggled to recover alongside the broader market.
Buyers have managed to defend the $1.24 support area, but $XRP has repeatedly failed to break above $1.27. A move past this resistance could give the price room to stage a stronger recovery.
After climbing back above $1.24, $XRP has spent the past three days trading within a narrow range. This sideways movement has caused its Bollinger Bands to tighten considerably.Notably, such periods of low volatility often come before sharp price movements.
$XRP Bollinger Bands Reach Their Tightest Levels Since August
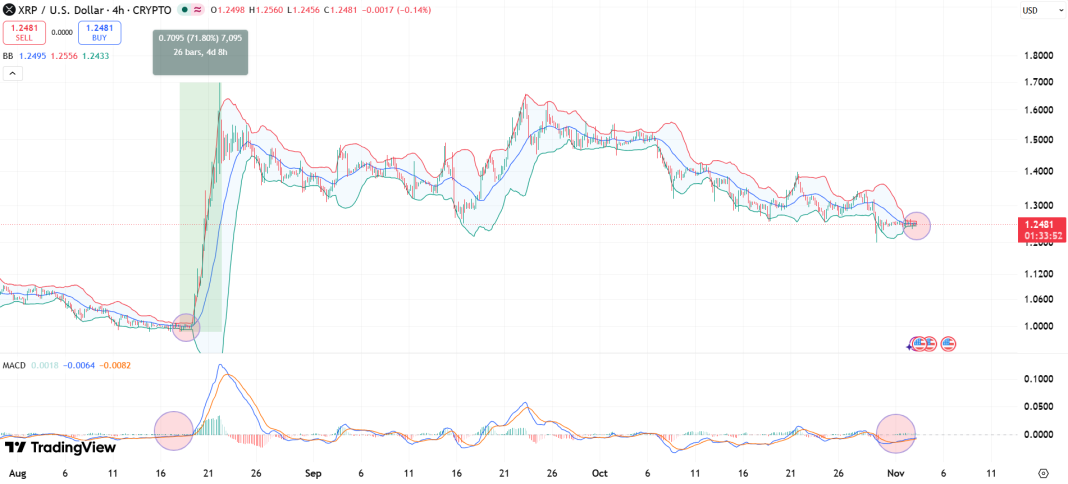
The 4-hour chart shows that $XRP Bollinger Bands have narrowed to their tightest levels since mid-August 2026. This is important because a similar setup appeared shortly before $XRP staged its last major rally, which pushed the price close to $1.70 within a few days.
At press time, $XRP trades at $1.2481. The upper Bollinger Band currently sits at $1.2556, while the lower band stands at $1.2433. This leaves only $0.0123 between the two bands, and this shows just how much volatility has dropped.
$XRP Bollinger Bands reach their tightest level since before the August rally
The difference is much smaller than the $0.1987 recorded between the upper and lower bands in early to mid-October. This decline shows that $XRPhas experienced a massive drop in price volatility over the past few weeks.
For context, Bollinger Bands measure price volatility by tracking the distance between an asset’s upper and lower price ranges. When volatility falls, the bands move closer together, and this creates what traders call a Bollinger Band squeeze.
This pattern often appears before a major price movement. When volatility returns, the price could break suddenly in either direction. However, a squeeze does not reveal whether the next move will be upward or downward.
$XRP Bollinger Bands Before August Rally
Despite the neutral nature of the current structure, $XRP bulls believe the next increase in volatility could push the price higher. Much of this optimism comes from the similarities between the current market conditions and those that appeared before the August rally.
On Aug. 18, $XRP dropped to $0.9882 during a market-wide decline. The price later recovered slightly above $1 but failed to make further gains. This led to a three-day period of consolidation, during which the Bollinger Bands became extremely narrow.
By Aug. 19, the difference between the upper and lower bands had fallen to just $0.0073. This showed that $XRP had entered a period of very low volatility, similar to what the four-hour chart is showing now.
The market eventually experienced a sudden return of volatility, which came with a strong upward move.$XRP climbed to $1.6977 by Aug. 22, gaining approximately 71% from its Aug. 18 low of $0.9882.
These similarities have given $XRP bulls reasons to expect another rally. Specifically, $XRP has recently suffered a sharp decline, recovered above $1.24, and spent three days consolidating. This closely resembles the price action that preceded its August surge.
$XRP MACD Also Shows Similarities to August
The Moving Average Convergence Divergence (MACD) indicator on $XRP’s four-hour chart is also showing a pattern similar to the one recorded in mid-August.
During that period, the MACD turned positive after $XRP recovered from its decline. However, it remained within a very low positive range throughout the consolidation period. The indicator then strengthened as the rally began.
A similar pattern appears to be developing now. Following its recent recovery above $1.24, $XRP MACD has continued to follow the same general structure seen in mid-August.
However, these similarities do not guarantee that $XRP will repeat its August rally. Although the indicators suggest that a major price movement could be approaching, the next move could still be downward. A further decline across the broader crypto market could also put additional pressure on $XRP.

 thecryptobasic.com