Cardano Long-Term Structure Supports Possible ADA Move Toward $3.10
thecryptobasic.com
59 m
Cardano’s nine-year development milestone has renewed attention around $ADA’s long-term price potential, with market analyst Lana Valentis highlighting the feat as a potential catalyst for further upside.
Cardano officially marked its ninth anniversary in September 2026, providing the backdrop for Valentis’ long-term analysis of $ADA.
In a post on X, Valentis highlighted several milestones from Cardano’s nine-year development journey, including 123.9 million total transactions, 2,890 active stake pools, and 158 governance actions.
Know when your coins move
Alerts, real-time prices, and market news — all in one app
4.8 based on 40K reviews in the App Store and Google Play
According to her, these milestones show the network’s development over the past nine years and could lay the groundwork for long-term price expansion.
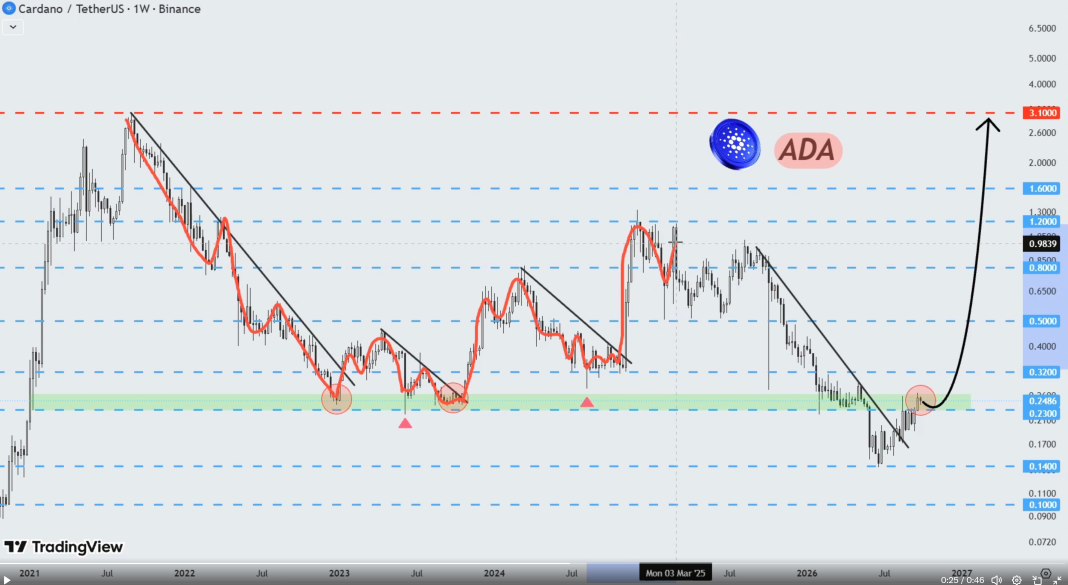
Meanwhile, $ADA has also shown signs of technical improvement. Valentis noted that the token had crossed and closed above a major resistance zone around $0.24 on the weekly chart, which she interpreted as a potential breakout.
$ADA Targets $3.10?
Following the breakout above the $0.24 resistance area, Valentis identified several potential upside levels for $ADA, including $0.32, $0.50, $0.80, $1.20, and $3.10.
The chart places $0.32 as the initial resistance area, followed by $0.50 and $0.80. If $ADA moves through those levels, the $1.20 region could become the next area of interest before the longer-term $3.10 target.
The $3.10 level represents $ADA’s previous all-time high, which the token reached in September 2021. However, Valentis did not specify a timeframe for $ADA to revisit that level.
Cardano Chart by Lana Valentis
$ADA Remains Far Below Its Previous All-Time High
At $0.2547, $ADA would need to surge by 1,117% to return to its previous all-time high of $3.10. Based on a circulating supply of 36.78 billion $ADA, a price of $3.10 would correspond to a market cap of roughly $114 billion.
Meanwhile, the chart shows $ADA recently finding support in the $0.23- $0.25 region after falling toward $0.14 earlier in 2026. From that base, the token has begun attempting to recover above a longer-term downtrend line.
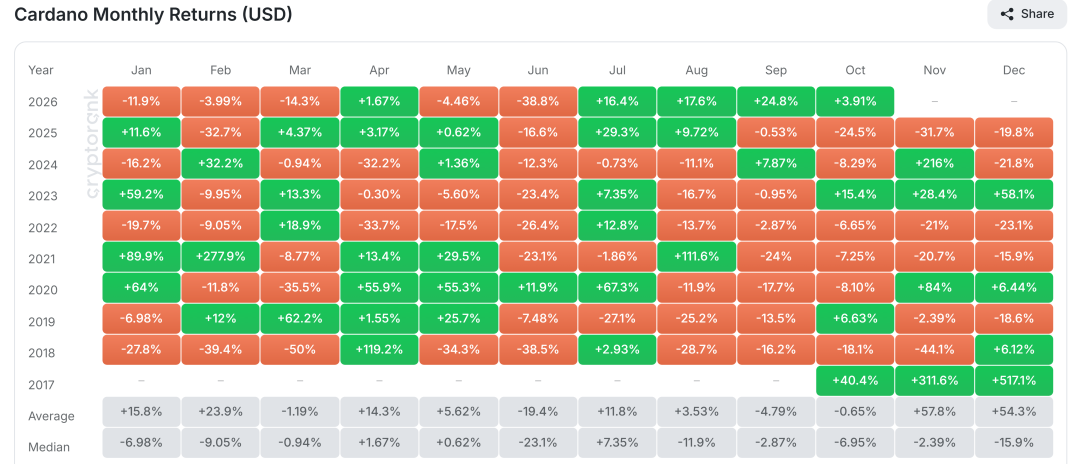
At the time of the analysis, $ADA was up 4% over the past day, while its weekly gain stood at roughly 0.9%. The token had also spiked about 3.91% month-to-date.
Network Growth Alone Does Not Determine $ADA’s Price
Although Valentis points to Cardano’s network milestones as evidence of its long-term development, a sustained recovery toward $3.10 would depend on factors beyond historical network activity.
In particular, adoption, network usage, ecosystem development, broader market conditions, and demand for $ADA could influence whether the token sustains a significant long-term recovery.
This distinction is relevant amid recent criticism within the Cardano community over $ADA’s market performance. Cardano founder Charles Hoskinson responded by stating that he is not responsible for driving Cardano adoption, emphasizing that the network is decentralized and that he holds no official role in controlling its adoption.
$ADA’s October History Remains Mixed
$ADA’s historical October performance also provides a contrasting backdrop to the current bullish technical structure.
Since its inception, Cardano has recorded positive October closes in 2017, 2019, and 2023, with gains of 40.4%, 6.63%, and 15.4%, respectively.
By comparison, $ADA recorded negative October returns in 2018, 2020, 2021, 2022, 2024, and 2025, with declines of 18.1%, 8.1%, 7.25%, 6.65%, 8.29%, and 24.5%, respectively.
Consequently, $ADA’s historical October performance produces an average return of -0.65% and a median return of -6.95%.

 thecryptobasic.com