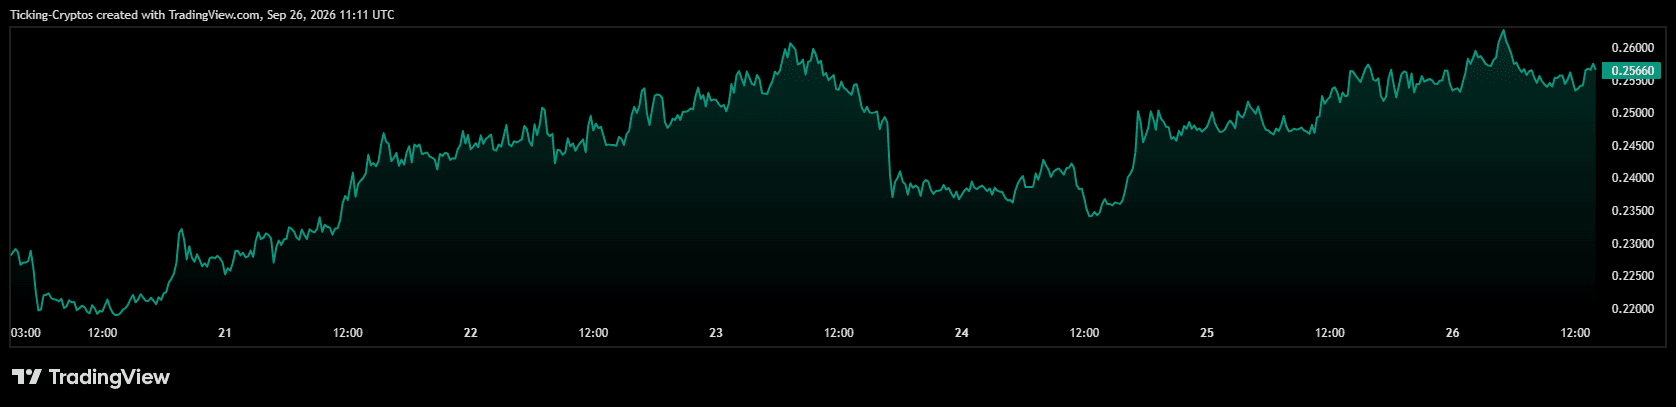
$ADA Price Analysis: Cardano Price Action is Bullish
The daily chart explains why traders are paying attention. Cardano closed above its 200-day EMA at $0.2395 for the first time since April, and it also cleared the $0.245 level that capped the price during spring. Both now act as support.
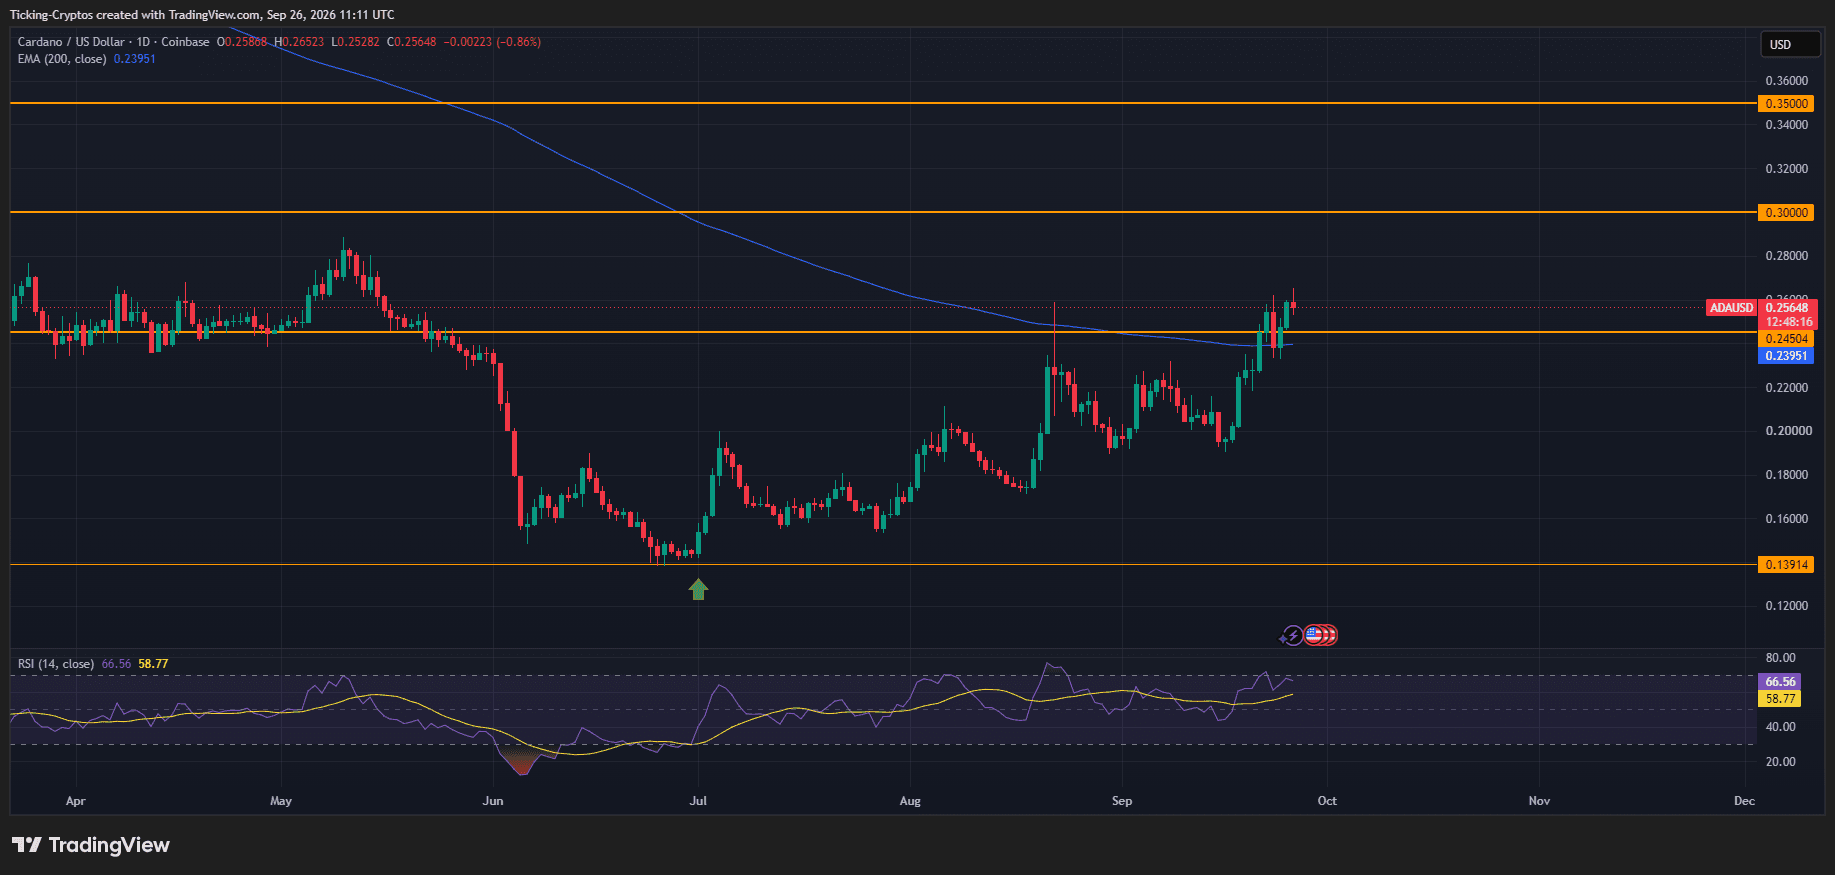
The RSI sits at 66, above its signal line but not yet overbought. Momentum is strong without being stretched. You can follow the live levels on the CryptoTicker charts.
Cardano Price Prediction: Can $ADA Reach $0.30?
If $ADA holds above $0.245 on a daily close, the next target on the chart is $0.30. That is a round number, a former support zone from the spring, and a psychological level that will attract attention. Above $0.30, the next resistance sits at $0.35.
The setup favours the bulls as long as the 200-day EMA holds. A weekly close above $0.26 would confirm the breakout and open the way to $0.30 in the coming weeks.
What Could Send $ADA Back Down?
The risk is a failed breakout. If $Cardano drops back below the 200-day EMA at $0.2395, the whole move looks like a bull trap, and the price could revisit $0.22 or the September low near $0.20. The June low at $0.139 remains the worst case for this cycle. $ADA is still down sharply from its yearly high near $0.285, so the market will want proof before chasing higher.

 cryptoticker.io