
 ambcrypto.com

Cash Cat [$CASHCAT] has declined in the past day. The asset has dropped 16% as of writing, which, by depth, remains one of the biggest losses for a crypto asset within the top 200 assets by market capitalization.
While this may signal the start of a bearish move, it could also be a potential retracement, especially as $CASHCAT remains up by over 13,000% in the past three weeks.
$CASHCAT pulls back
The major concern over the recent $CASHCAT pullback has been the volume performance of the asset. At the time of writing, the volume is up 42%, reaching $21.35 million.
Rising volume alongside declining prices has always been connected to a growing bearish trend as more traders sell their positions. Volume analysis specific to the perpetual market of $CASHCAT, alongside Open Interest (OI), corroborates this as well.
The Long/Short Ratio, which tracks buyers against sellers, has plummeted to 0.823, implying there has been more selling volume as the ratio fell below 1. OI has also declined by a little over 10% in the past day to $22.52 million.
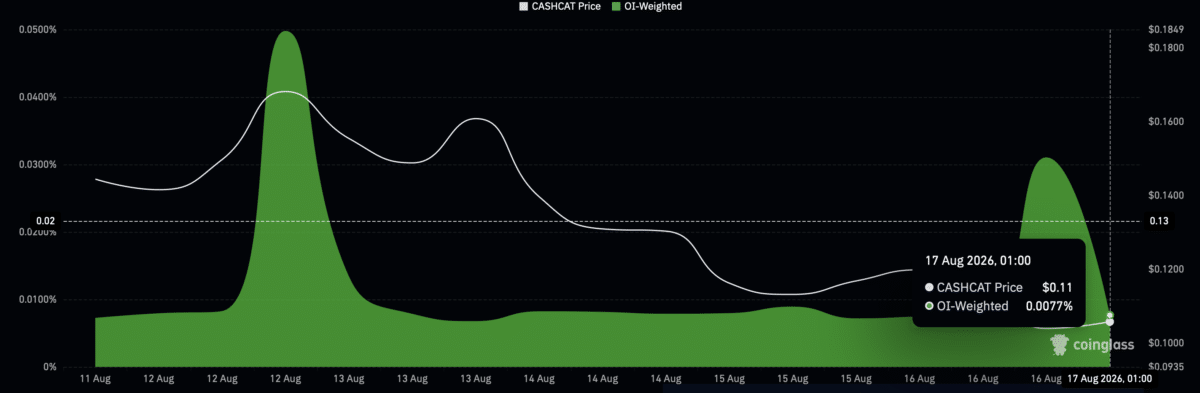
While this bearish outflow takes place, the funding rate, which contextualizes positions in the perpetual contract of an asset as being dominated by longs or shorts, shows that the former is still the case.
Press-time data shows that there are still more long contracts than shorts, as the funding rate hit 0.0077%, according to the chart reading.
$CASHCAT has found a bottom?
The 4-hour Bollinger Band analysis of $CASHCAT shows that the decline has forced the asset into an undervalued territory, and right now, it’s likely to surge higher.
The undervalued territory stems from the asset’s last red candle, which moved into the green lower band. Currently, the rebound is taking shape, with $CASHCAT already trending higher.
There are two notable levels worth watching from this point onward. First is the mid-band in blue ($0.120), which could act as potential resistance. If the buying pressure is high enough, the asset could surge toward $0.144, the red upper-band level.
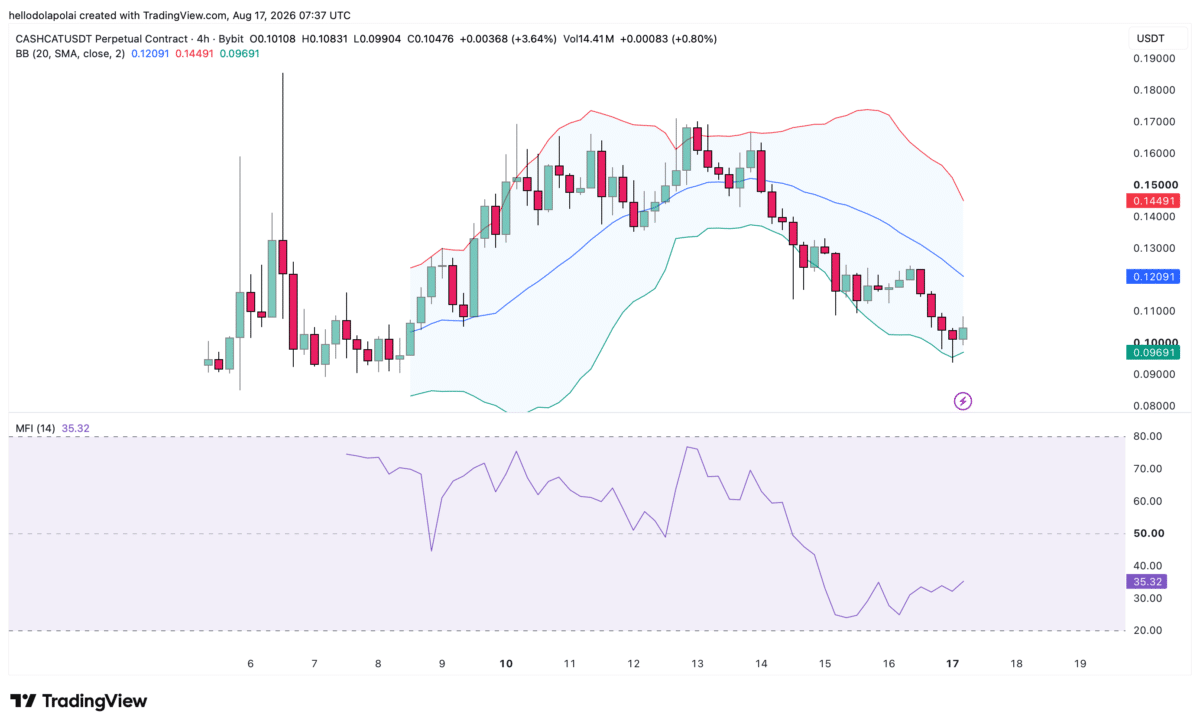
Capital inflow into the market has already been helping the narrative as it continues to surge. The Money Flow Index (MFI) has been gradually rising, with a reading of 35.52, while pointing upwards and implying that there is ongoing buying pressure.
If the MFI continues to build up, then there’s a high chance that $CASHCAT continues to see a rebound, adding to the outlook that the asset is likely to extend its gains even further from its present level.
Liquidation flow is massive
The liquidation data shows that there’s a massive gap between long and short positions on the chart.
There was a total long liquidation of $442,350 in $CASHCAT positions, with a meager $483.79 in short-position losses at the same time.
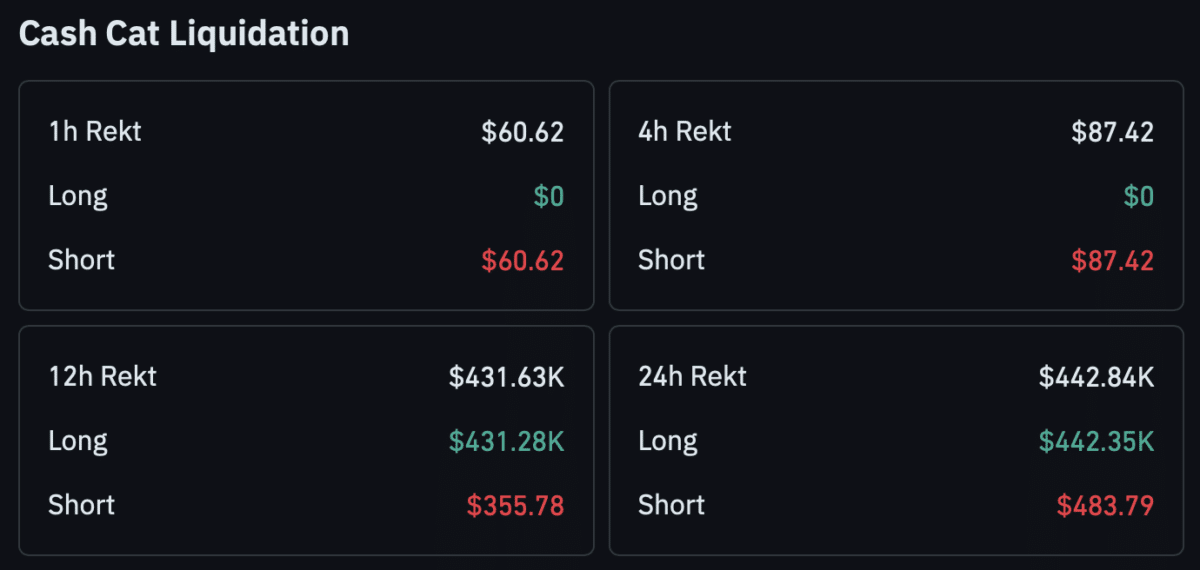
The disparity shows there’s a massive risk in betting long, as there are 914 times more long losses than short losses in the market.
Despite the chart suggesting a bottom, it’s important that traders approach the market with caution and avoid becoming overly bullish on their positions.
Final Summary
- $CASHCAT has dropped 16% in 24 hours, while rising volume and falling open interest point to growing selling pressure.
- Bollinger Bands and rising MFI suggest $CASHCAT could rebound, but heavy long liquidations keep downside risks elevated.