
 ambcrypto.com
Aave’s [$AAVE] prices fell 4% in the past 24 hours. On Friday, the 31st of July, the DeFi token reached the day’s high at $101.57. Within the 48 hours that followed, the token declined by 11.2%.
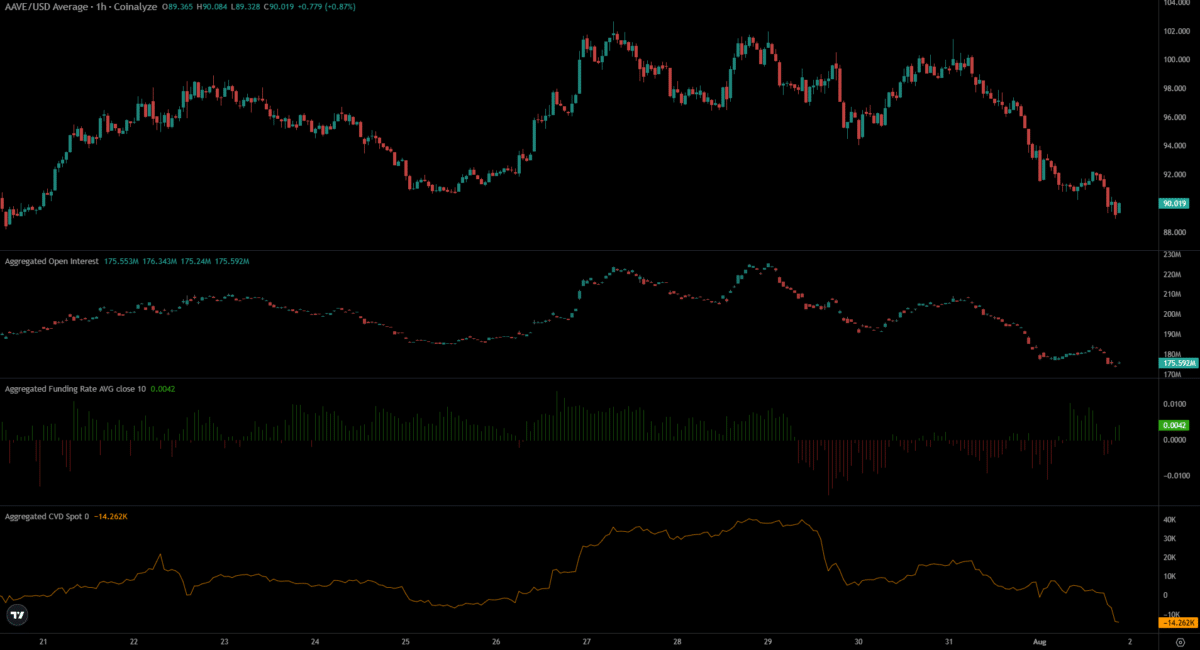
Coinalyze data showed a 5% drop in Open Interest in the past 24 hours. Additionally, the Spot CVD was declining over the past few days. Together, it showed selling pressure in both the speculative and derivatives market.
The Funding Rates had been negative in recent days, showing heightened willingness among market participants to go short. The rates have flipped toward positive territory.
The short-term $AAVE outlook is bearish, following its attempts to rise above $100 over the past week and the subsequent failures.
In other Aave news, Stani Kulechov, the protocol’s founder, said that they plan to scrap 50 reserve assets with low adoption and wind down deployment on six chains.
The overarching bearish trend has yet to loosen its grip
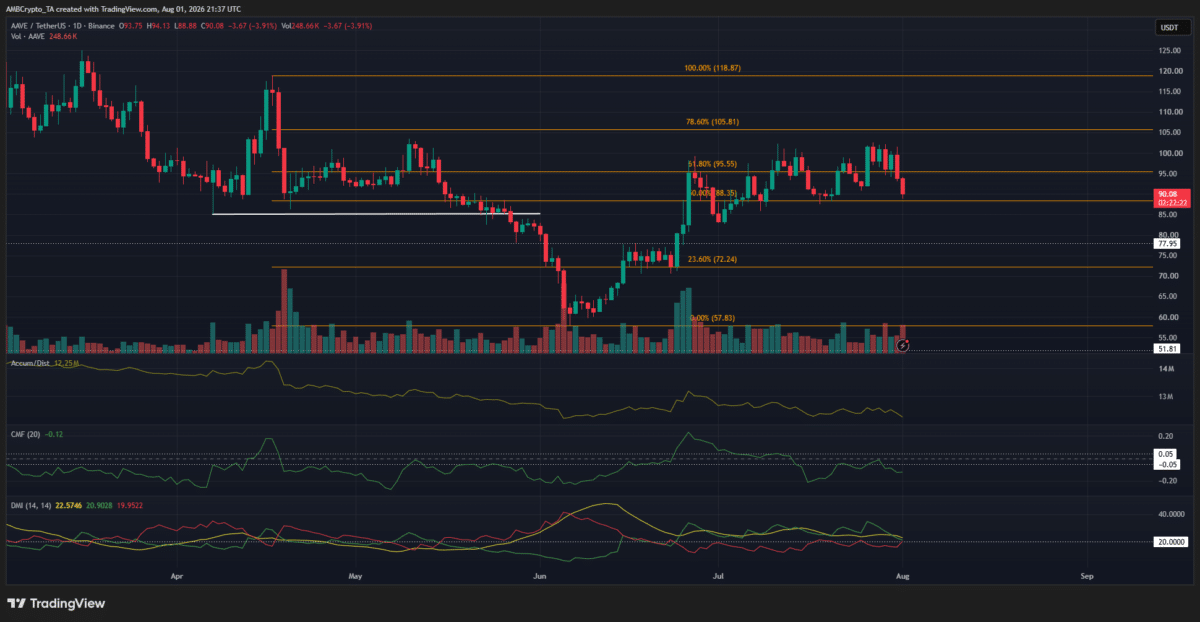
The swing structure on the 1-day chart was bearish. The downward continuation was confirmed in May, when the previous swing low (white) at $85.05 was breached, and a new low at $57.83 was set.
Using the high before the bearish breakdown to anchor the Fibonacci retracement levels (orange), we can see that the 78.6% level at $105.81 has not yet been overcome.
Hence, the rejection from the psychological $100 supply zone was a good sign of further downside in store for the altcoin.
The technical indicators also agreed with a bearish bias. The CMF was below the -0.05 line to show strong capital outflows, and the A/D indicator was also slowly declining since April.
Hence, further losses appear likely.
Short-term $AAVE bias
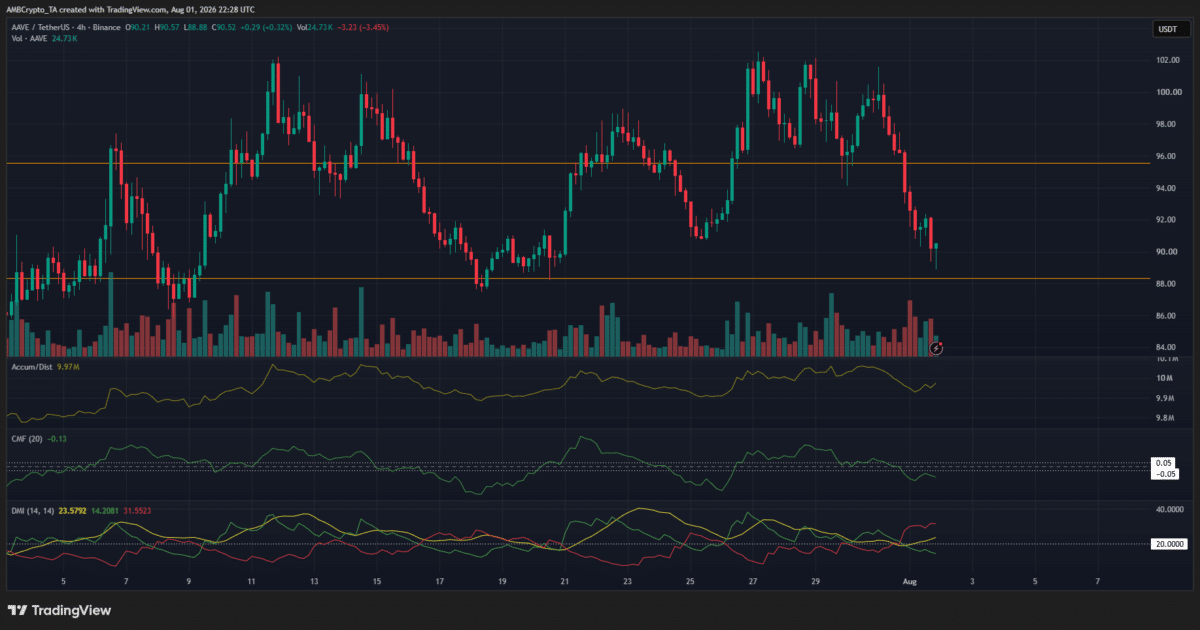
For most of July, $AAVE had oscillated between $88 and $100. At the time of writing, the token was trading closer to the lows. The -DI and ADX (red and yellow lines, respectively) of the DMI were above 20, showing a strong downtrend in progress.
The CMF was also below -0.05, just like on the daily chart.
If the $88 demand zone is ceded to the bears, an extended drawdown toward $83 and $72 will become more likely.
Final Summary
- The Aave bulls’ challenge of the $100 resistance zone was firmly refuted.
- The local support zone at $88 will be key in the short term.