cryptopotato.com
Ripple’s $XRP has shown signs of stabilization after its prolonged downtrend, with buyers successfully defending a key support region and triggering a short-term market structure shift. Although the broader trend remains bearish, the recent price action suggests that selling pressure is weakening, and the market may be preparing for a larger recovery attempt if current support levels continue to hold.
$XRP Price Analysis: The Daily Chart
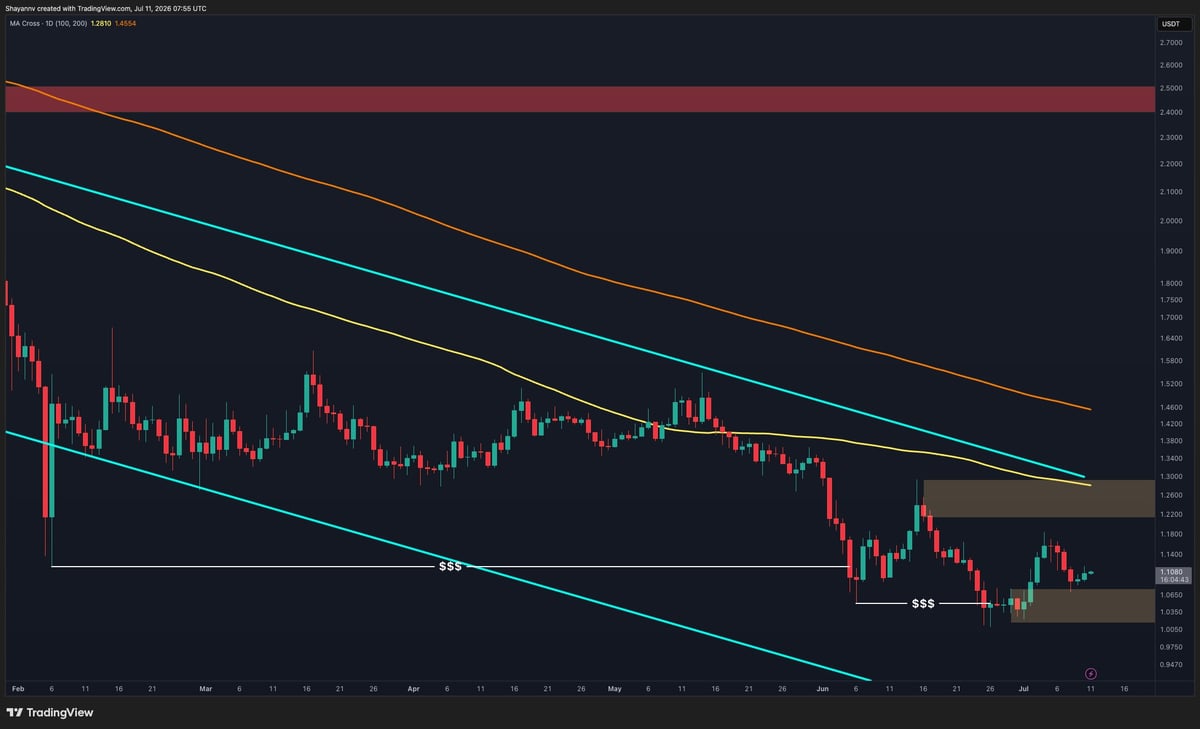
On the daily timeframe, $XRP remains inside a broader descending channel and continues to trade below the 100-day and 200-day moving averages, which are both trending lower and maintaining the long-term bearish structure.
However, the recent decline toward the $1.02-$1.06 support zone appears to have attracted significant demand. This region aligns with a previous liquidity sweep below the April lows, where the market briefly traded beneath support before quickly recovering. Since then, the asset has established a higher low and has begun building a base above this demand area.
The price recently bounced from the support zone and is now attempting to reclaim the horizontal resistance region around $1.22-$1.28. This area is particularly important because it also coincides with the descending 100-day moving average and the upper boundary of the broader bearish structure.
A successful reclaim of the $1.22-$1.28 resistance zone would strengthen the recovery scenario and potentially open the path toward the major supply area near $1.55. Until that breakout occurs, the broader trend remains corrective within a larger downtrend.
$XRP/USDT 4-Hour Chart
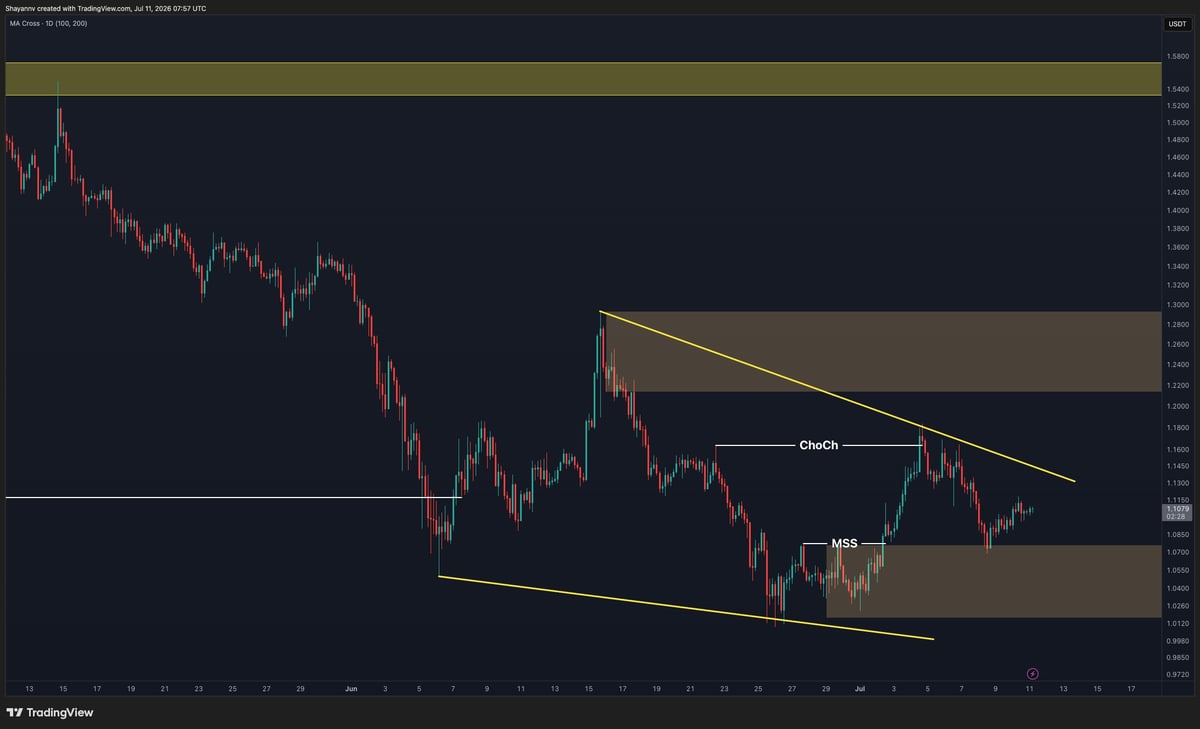
The 4-hour chart presents a more constructive outlook. Following the sweep of liquidity below the $1.02-$1.06 support region, $XRP formed a market structure shift (MSS), marking the first indication that sellers were losing control of the short-term trend.
The subsequent rally produced a change of character (ChoCh) as the price broke above a previous lower high and challenged the descending trendline that has capped rallies since mid-June. Although the token initially faced rejection near trendline resistance around $1.16-$1.18, the pullback has remained relatively shallow, and buyers continue defending the former breakout zone.
Importantly, the market has not returned to the lows despite the rejection, suggesting that demand remains active beneath current prices. As long as $XRP holds above the $1.03-$1.06 support area, the bullish structure established after the liquidity sweep remains intact.
The key level to monitor now is the descending trendline and the $1.15-$1.18 resistance area. A decisive breakout above this region would confirm a higher-high formation and could accelerate momentum toward the larger daily resistance zone between $1.22 and $1.28.
Conversely, failure to break the trendline could lead to additional consolidation between support and resistance before a larger directional move develops.
Overall, the recent price action favors gradual recovery, but $XRP still needs to reclaim the trendline resistance and the $1.22-$1.28 supply zone before a broader bullish reversal can be confirmed.