EGRAG Crypto, one of the most prominent analysts on crypto Twitter, has identified the bottom price for $XRP this June in its worst-case-scenario crash.
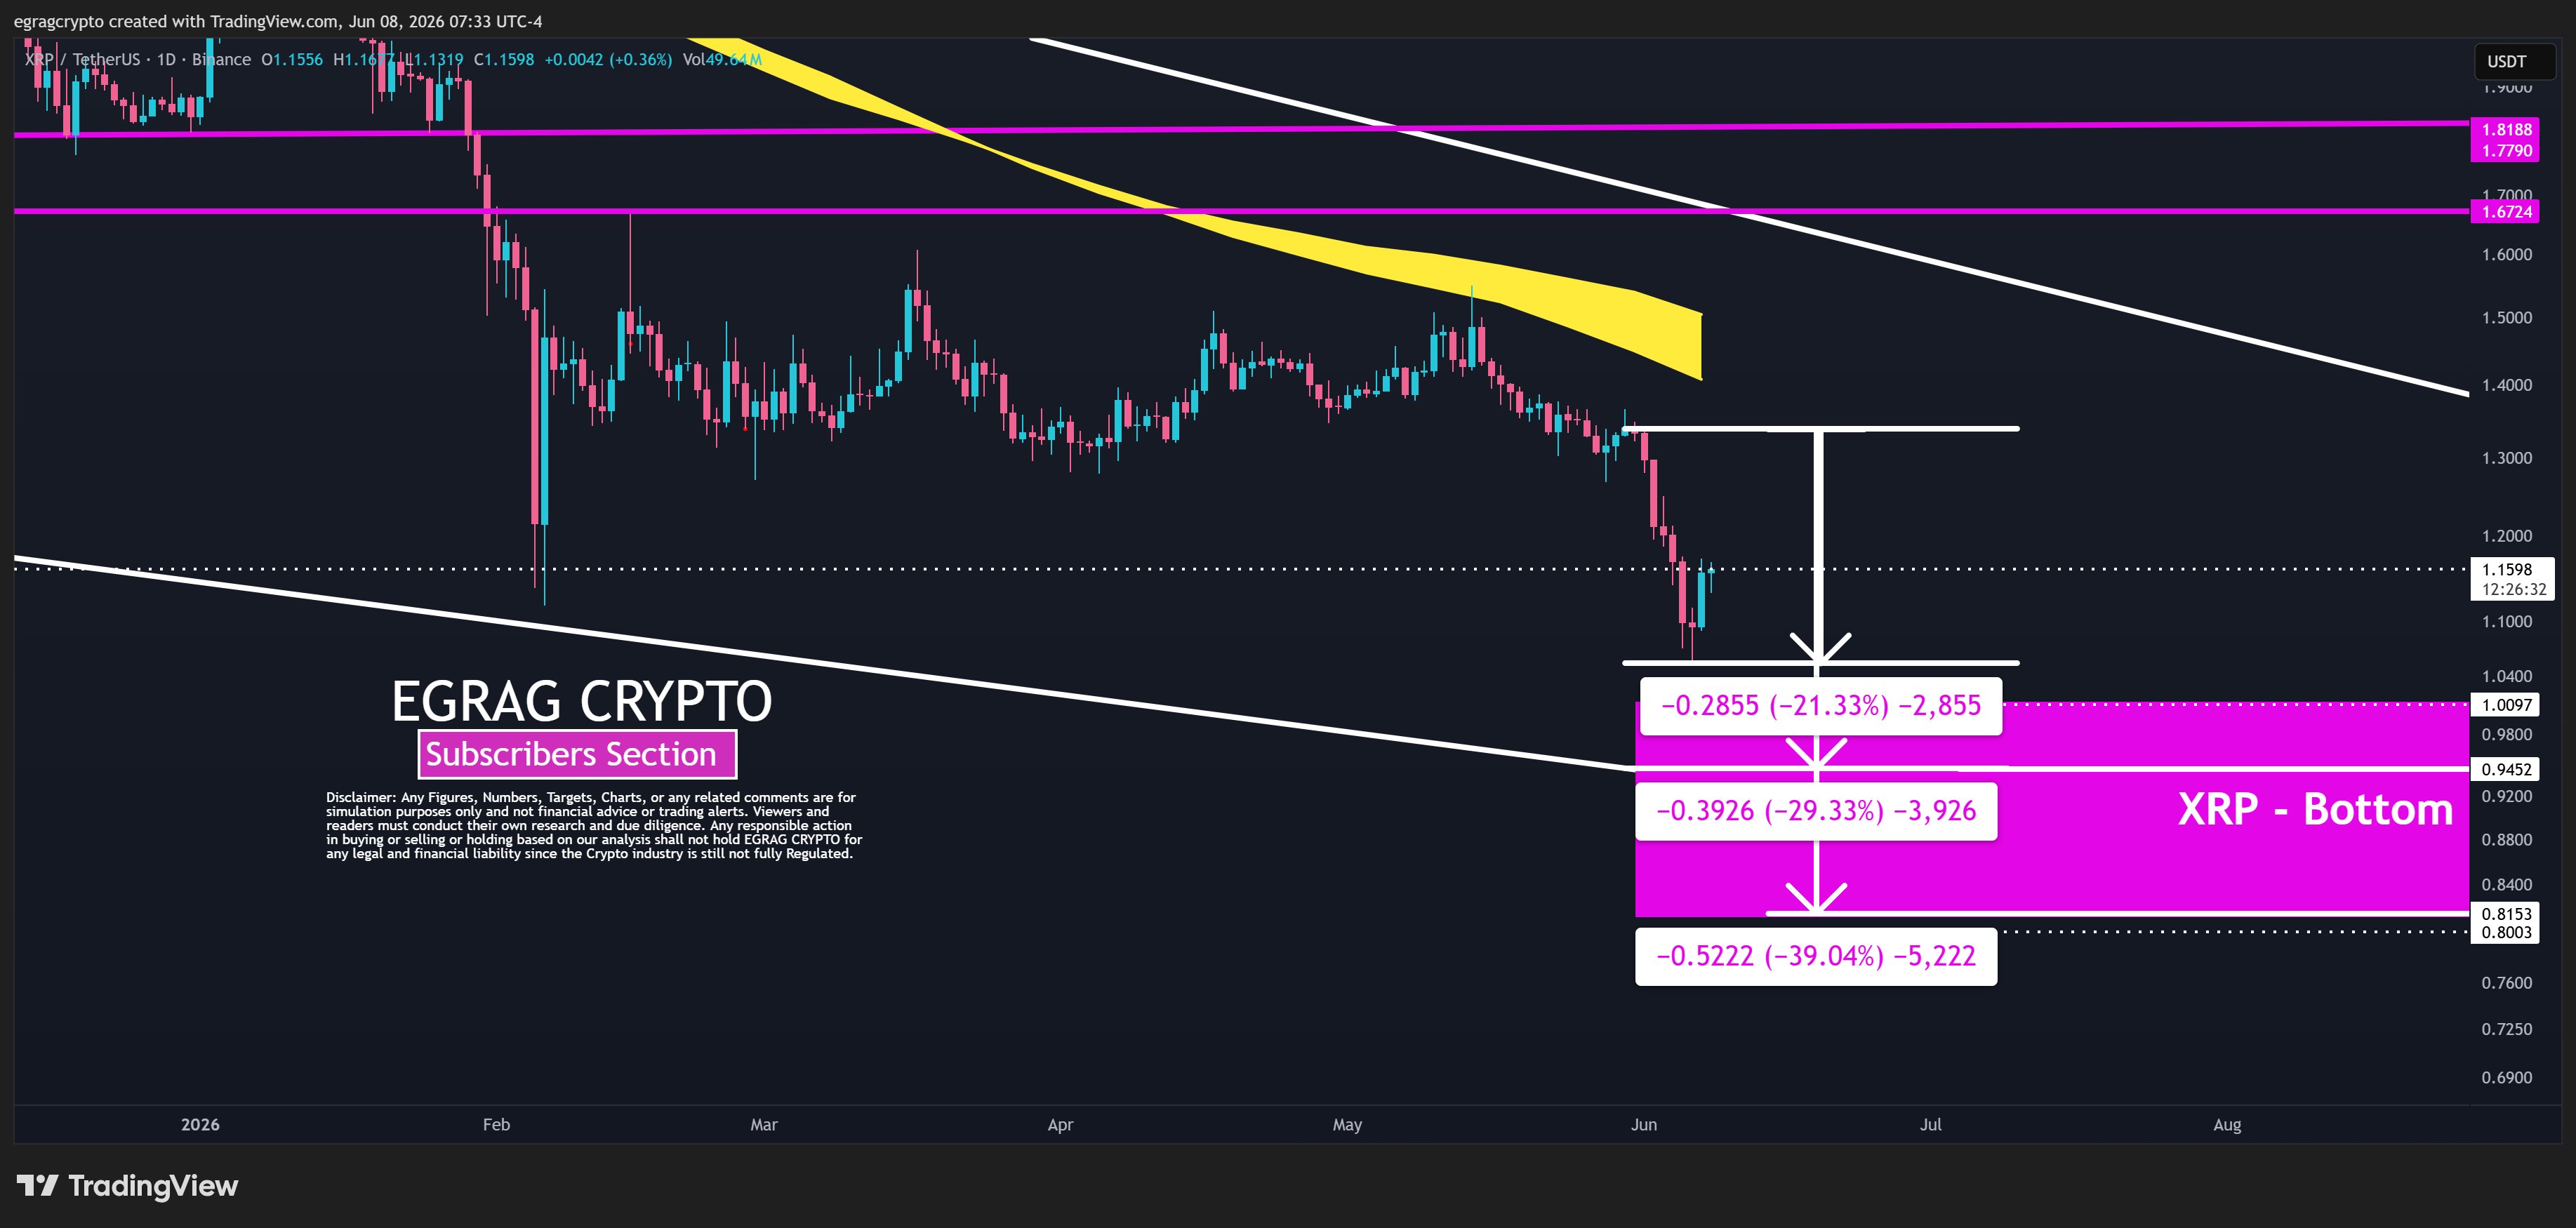
According to EGRAG, the ongoing market downtrend has still not reached its lowest level for this month. He believes market data puts $XRP’s average June slump in midterm years at 29.3%, representing a drop to $0.94. However, in a worst-case scenario, he sees $XRP hitting $0.81.
The market expert made this assessment using historical data surrounding $XRP’s June performances across midterm years. He presented his formula at the beginning of June, projecting a downtrend this month despite $XRP seeing a mild rebound push toward the end of May.
$XRP’s Downward Price Action
$XRP has been a victim of a broader market downtrend momentum that picked up at the start of this month. Notably, from May 28 to 30, $XRP saw three consecutive intraday gains, reaching $1.34. However, as June emerged, a pullback ensued.
This came as Bitcoin ($BTC) collapsed in response to Strategy’s 32 $BTC sale and U.S. job reports. $XRP crashed from $1.3 to $1.05, representing a 19% decline within six days. $XRP has recovered slightly to $1.16 at press time, but its price action remains weak, with traders expecting steeper declines.
EGRAG’s analysis comes amid this bearish expectation. While the market analyst remains bullish on $XRP, presenting a possible pathway to higher targets such as $27, he admits that June has always been a bearish month for the asset, especially in midterm years.
$XRP’s Bearish June Pattern
Specifically, EGRAG called attention to historical data confirming that $XRP has greatly underperformed in June during midterm years. This pattern has consistently played out since 2014, a year after $XRP began trading in the public market.
$XRP has gone through three midterm years since then, and in each of them, June saw a drastic price drop. For instance, in June 2014, EGRAG suggests that $XRP saw a 17% drop. The next midterm year, 2018, also brought another crash in June, with EGRAG claiming that $XRP slumped 39% then.
As for 2022, the analyst said $XRP saw a 32% price drop in June, and this coincided with the Terra implosion the month before. Although chart data suggests $XRP’s declines in each of these years were not as severe as EGRAG mentioned, the bottom line is that the asset always struggled in June during midterm years.
Worst-Case Scenario for $XRP This June
According to EGRAG, the average decline rate across these three years he assessed is 29.33%. He suggested that $XRP is already down 21% this June. If it follows the pattern to the letter, the average decline across the years assessed could take the price to $0.94.
However, the analyst stressed that the worst-case scenario for $XRP would see the crypto asset decline further to $0.81, representing a 39% crash in June 2026. Interestingly, analysts such as Casi and Chart Nerd have continued to project a possible $XRP drop to $0.81.