
 finbold.com
Stellar ($XLM) is gaining fresh bullish sentiment after a crypto analyst projected a potential breakout, forecasting a rally toward the $5-$11 range during the next altcoin season.
In this line, technical analysis shared by Mikky Bull Crypto in an X post on May 31 highlights a long-term ascending triangle pattern that has been developing on $XLM’s monthly chart since 2018.
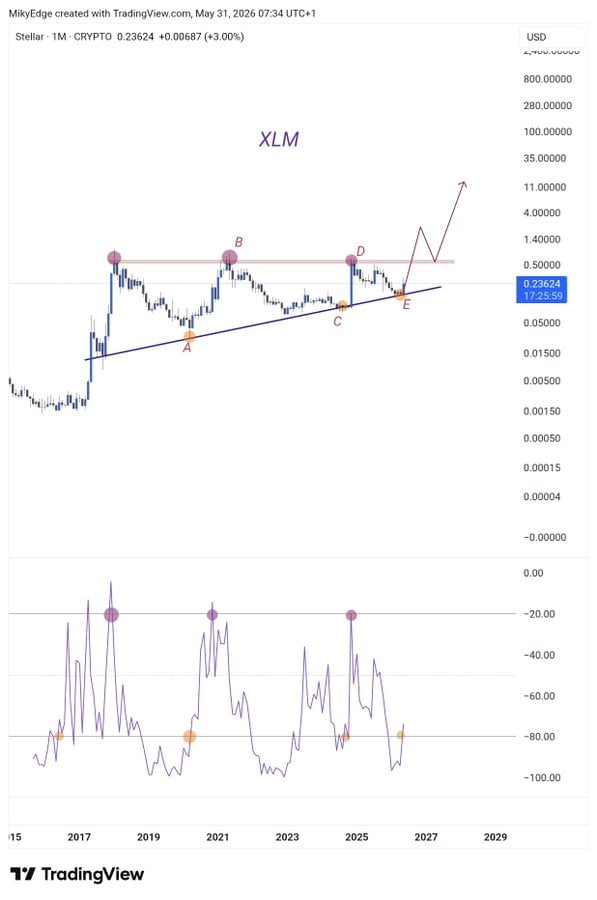
The chart shows a series of higher lows forming along an upward-sloping support trendline, while price repeatedly encounters resistance near the same horizontal level.
The analysis suggests $XLM is forming a long-term ascending triangle, with repeated tests of support and resistance strengthening the bullish setup.
The latest pullback has returned the asset to a key rising support level that previously preceded major rallies, while momentum indicators have reached oversold zones similar to those seen before strong advances in 2020 and 2024.
If resistance is broken, the pattern points to a potential move toward the analyst’s $5-$11 target range, an increase of almost 4,500% from the current value.
The bullish outlook comes as $XLM continues to benefit from growing institutional interest and expanding real-world asset (RWA) tokenization developments on the Stellar network.
$XLM’s recent rally was driven by the DTCC’s decision to integrate its tokenization platform with the Stellar blockchain.
The initiative, which will begin testing in July 2026 ahead of broader deployment in 2027, could enable tokenized stocks, ETFs, U.S. Treasuries, and other traditional assets on Stellar.
The announcement sparked a surge of more than 70% in $XLM, pushing the cryptocurrency to its highest level of 2026 and outperforming the broader market.
$XLM price analysis
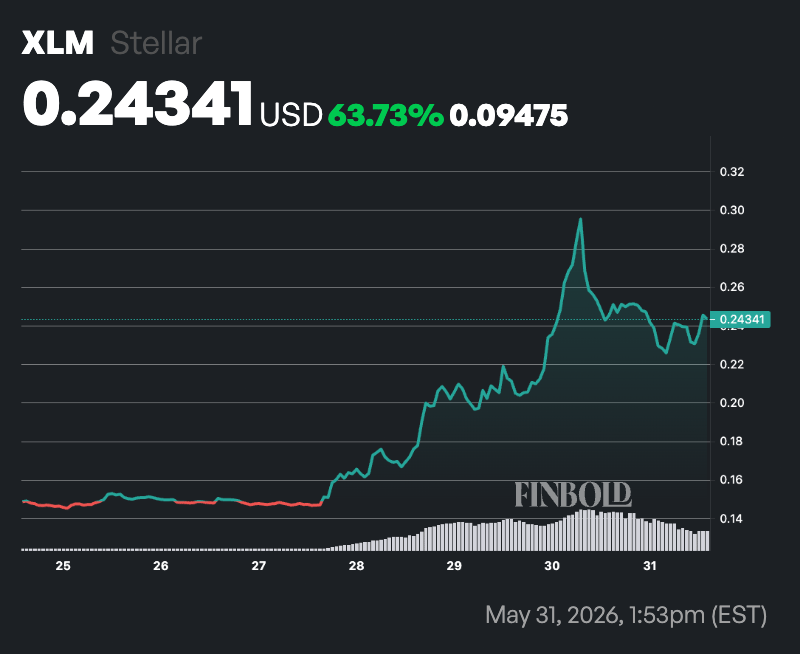
By press time, $XLM was trading at $0.24, having dropped 0.85% in the past 24 hours, while on the weekly timeline, the asset has surged 63%.
$XLM remains in a strong uptrend, with its current price trading well above both the 50-day simple moving average (SMA) at $0.1627 and the 200-day SMA at $0.1907.
This bullish alignment, where the shorter-term SMA sits above the longer-term SMA, indicates that upward momentum remains intact despite recent volatility.
However, the 14-day Relative Strength Index (RSI) stands at 86.61, placing $XLM deep in overbought territory.
While this reflects strong buying pressure and sustained investor interest, it also suggests the asset may be vulnerable to a short-term pullback or consolidation before attempting another leg higher.