
Ripple ($XRP) is trading above $1.37, struggling to find a solid footing at the time of writing on Tuesday amid a broad crypto market drawdown. The persistent decline marks the fifth consecutive day of sellers tightening their grip, leaving $XRP vulnerable.
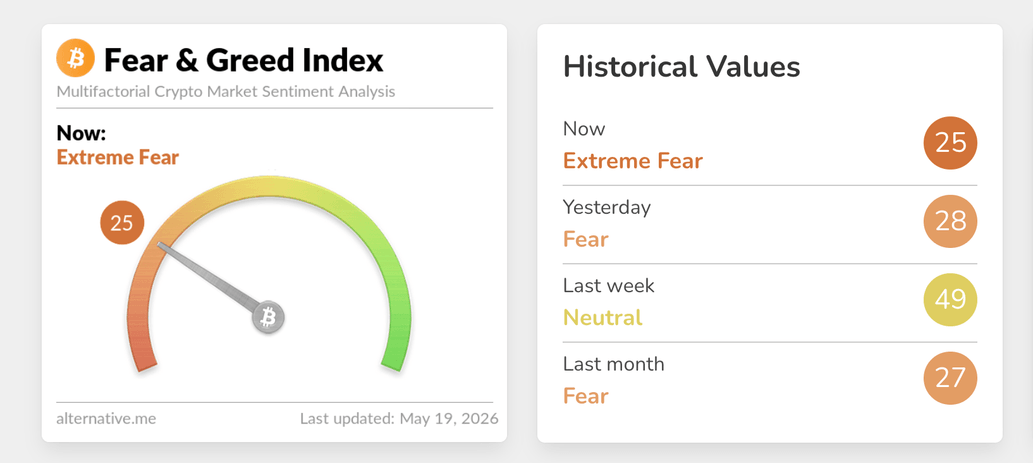
Risk appetite is generally cooling, as evidenced by the crypto Fear & Greed Index, which measures market sentiment, falling to 25 in the Extreme Fear territory on Tuesday, down from 28 the previous day and 49 last week.
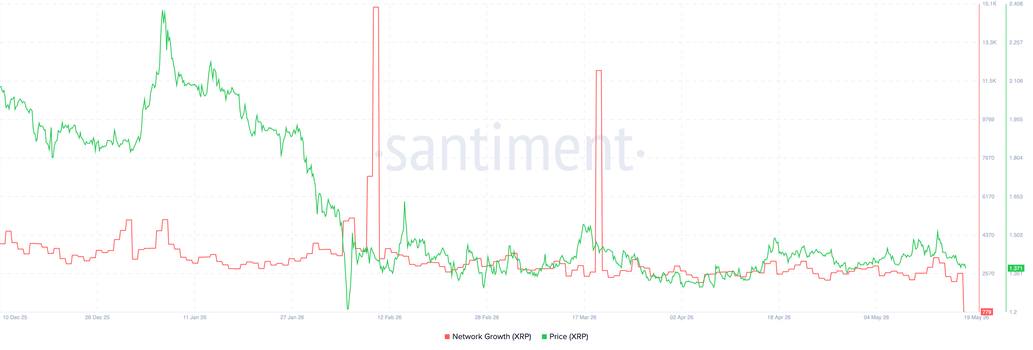
$XRP network growth cools amid modest ETF inflows
The $XRP Ledger (XRPL) continues to face declining adoption, with fewer new users joining the protocol. According to Santiment data, newly created addresses on the network dropped sharply near 780 on Tuesday, from roughly 2,600 the previous day.
Such a decline is an early signal of fading user adoption, interest and demand for the $XRP. Fewer users on the blockchain could mean low network activity or speculative inflows needed to reinforce a steady bullish outlook, shifting the edge toward defensive positioning until growth metrics stabilize or reverse.
$XRP spot Exchange-Traded Funds (ETFs) mirror the protocol’s weakness and loss of appetite, as inflows plunged a mere $750,000 on Monday, from nearly $11 million on Friday. Although cumulative inflows steadied at $1.39 billion, net assets under management narrowed to $1.14 billion from $1.18 billion over the same period.
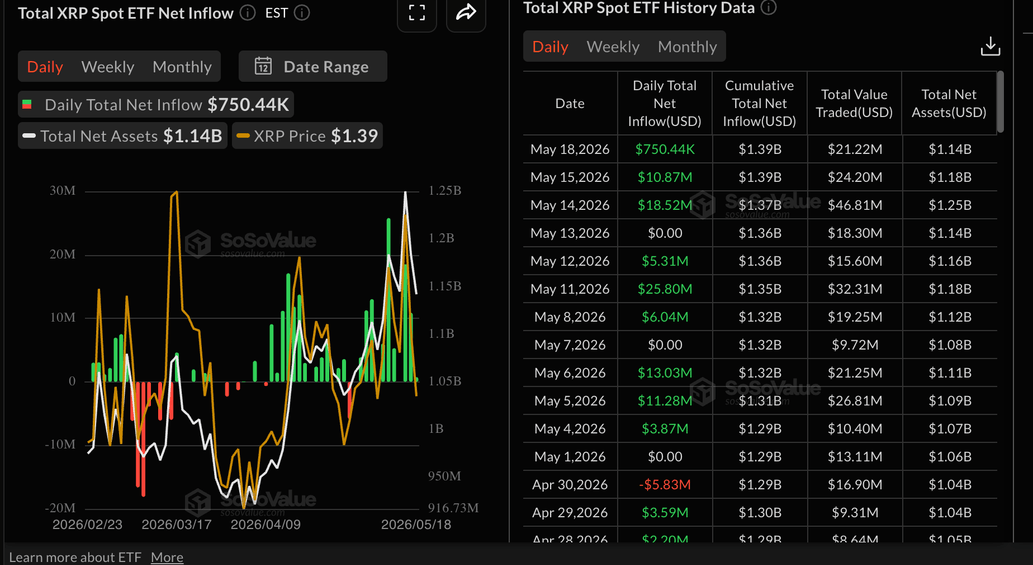
Sustaining inflows into the ETFs could help stabilize sentiment and raise the odds of a recovery. However, if institutions sense uncertainty and pull their funds, declines could accelerate.
Price analysis: $XRP slides as pressure builds
$XRP trades above $1.37, extending its retreat below a dense cap of moving averages and a recently broken ascending trendline, which keeps the near-term bias bearish. Momentum indicators reinforce the downside tilt, with the Relative Strength Index (RSI) slipping to about 43 on the daily chart and the Moving Average Convergence Divergence (MACD) histogram turning negative below the zero line, even as the Money Flow Index (MFI) stabilizes near 50, hinting at balanced but fragile flows.
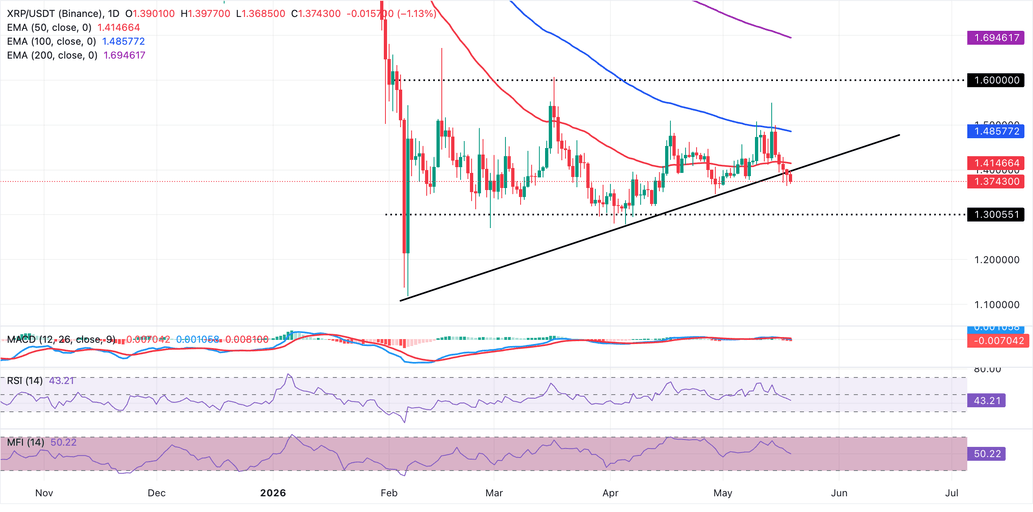
On the topside, initial resistance lies at the ascending trendline break near $1.40, followed by the 50-day Exponential Moving Average (EMA) at $1.41, which would need to be overcome to ease immediate selling pressure. Above that barrier, the 100-day EMA at $1.49 marks the next supply area ahead of the more distant 200-day EMA around $1.69, which frames the broader downbeat structure.
If the sell-off continues, $XRP could drop to retest a short-term support at $1.35, with extended pressure likely to expose a deeper demand level at $1.30.
(The technical analysis of this story was written with the help of an AI tool.)