
$NEAR Protocol [$NEAR] has joined the list of AI-linked tokens gaining market attention, with the asset posting double-digit gains as sentiment continues to improve in its favor.
While there is a strong possibility that the asset could rally further to the upside, there is still a tendency that the bullish move may not be fully confirmed yet, considering the fractal pattern currently forming in the market.
Bullish pattern still faces risk
Near Protocol’s [$NEAR] chart structure presents a setup that suggests the potential for a bullish run, although the breakout remains uncertain for now.
This stems from the fact that $NEAR has yet to breach the resistance level of a bullish formation known as the ascending triangle pattern, which the altcoin continues to trade within.
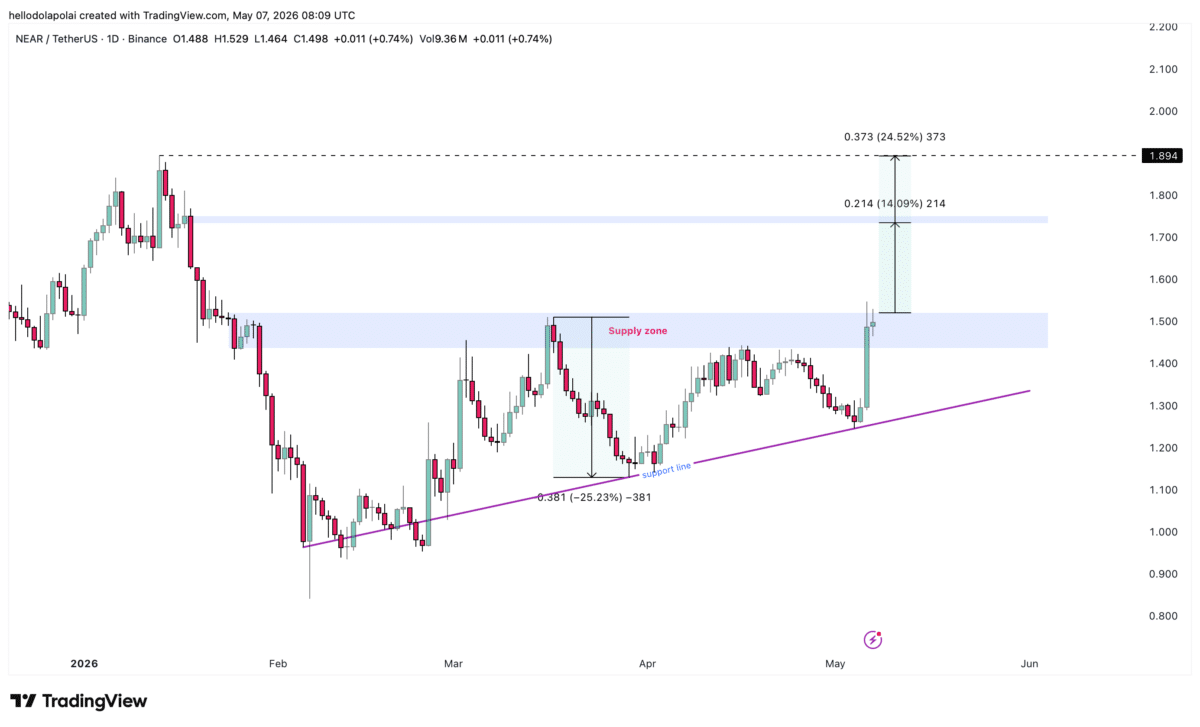
In previous instances, this supply zone has triggered a decline of nearly 25% toward the support level of the pattern. A similar setup could once again force the asset lower toward support before any sustained rally materializes.
Despite this risk, the market still shows decent upside potential.
A breakout above the supply zone would indicate that the asset could extend its gains by around 14% toward $1.7, while a stronger rally phase could push $NEAR as high as $1.8, representing a potential 24% upside move.
Indicators show positive momentum
Early bullish signals are already emerging, suggesting that the possibility of a breakout above the supply level remains intact.
The Aroon Indicator, which tracks an asset’s momentum and trend strength, currently points toward a bullish setup.
Typically, when the Aroon Up (orange) line trades above the Aroon Down (blue) line, it indicates bullish momentum, while the reverse signals a bearish trend shift.
At the moment, bullish sentiment remains dominant, with the Aroon Up at 92.85% while the Aroon Down stays at 78.57%. Usually, the wider the gap between the two lines, the stronger the trend.
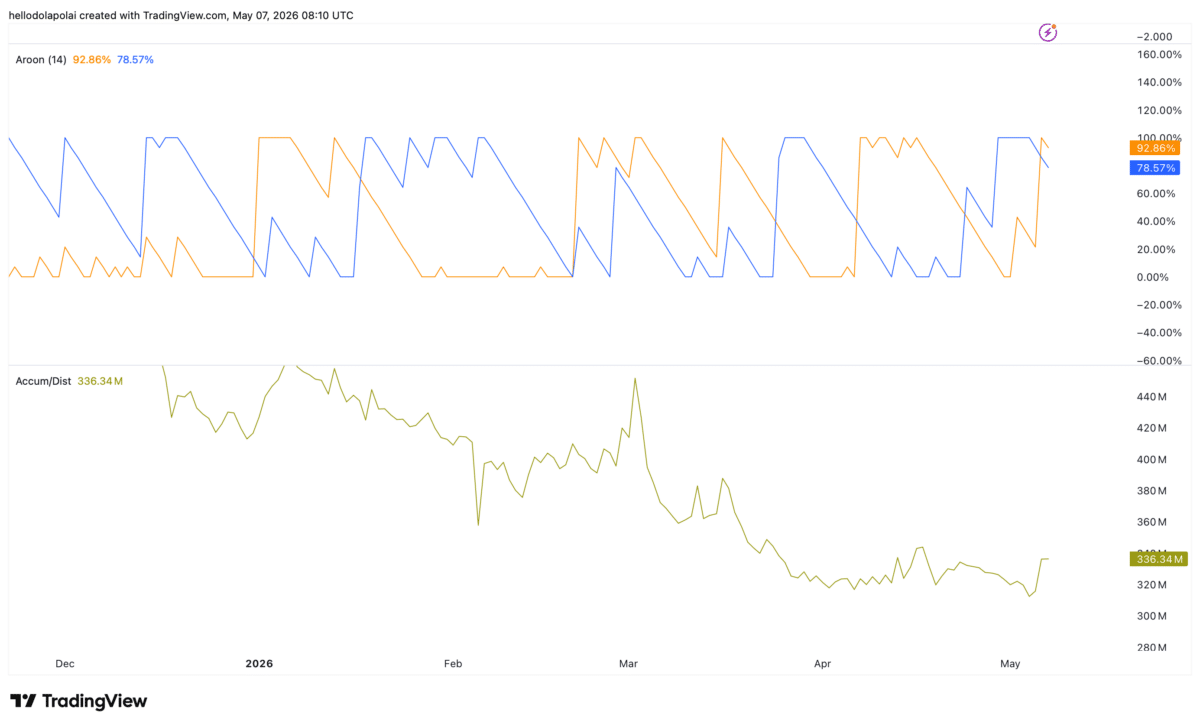
In this case, the gap remains relatively narrow, suggesting that bulls still control the market, although momentum has not yet reached a fully aggressive stage.
Adding to this outlook is the gradual accumulation trend among investors, showing that market participants have continued buying the asset steadily, even though accumulation has remained mostly flat over the past day.
Stronger accumulation could play a major role in $NEAR’s near-term performance, especially if the gap between the Aroon indicators widens further.
Liquidation heatmap supports upside case
The Liquidation Heatmap helps identify areas on the chart where price is likely to move based on liquidity clusters present in the market.
At the moment, the heatmap supports the broader bullish outlook, as significant liquidity clusters remain above the current price, extending toward the $1.6 region on the chart.
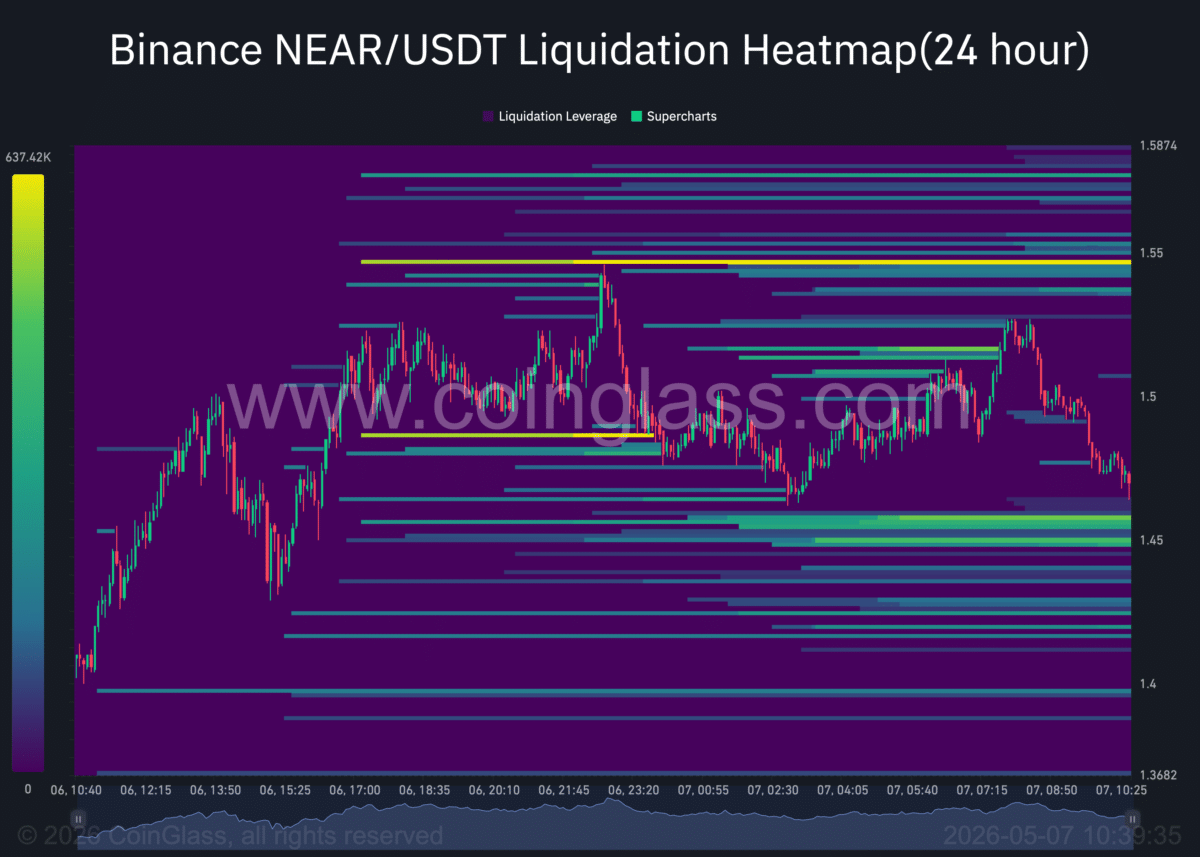
However, the setup remains a two-way scenario, as liquidity clusters also exist below the current price level. This suggests that $NEAR could still move lower if overall market momentum weakens or shifts bearish.
For now, bulls maintain the upper hand and are likely to benefit from further upside if current market conditions remain stable or improve further.
Final Summary
- $NEAR could extend its gains by another 24% if it successfully breaches the supply zone ahead.
- The Liquidation Heatmap shows liquidity clusters above price that could contribute to further upside momentum, although downside risks still persist.