
Ripple ($XRP) is edging lower below $1.40 at the time of writing on Tuesday, as the broader crypto market faces renewed volatility. The remittance token is under intense sell-side pressure and struggling to hold key support levels amid growing risk-off sentiment.
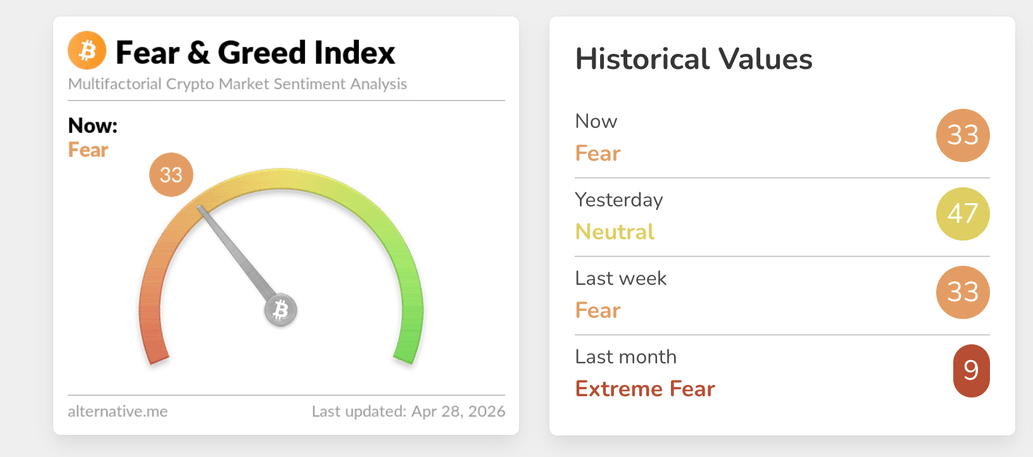
The conflict in the Middle East continues to drive investors on edge, while the crypto Fear & Greed Index declines to 33 on Tuesday, from 47 the previous day. Despite the United States (US)-Iran ceasefire holding, the Strait of Hormuz is still shut.
Reports say that US President Donald Trump is unlikely to accept Iran’s proposal to open the Strait, which skips Tehran’s nuclear program. Dismantling Iran’s nuclear program remains to be Trump’s hardline point to ending the war.
Risk-off sentiment persists amid muted ETF activity
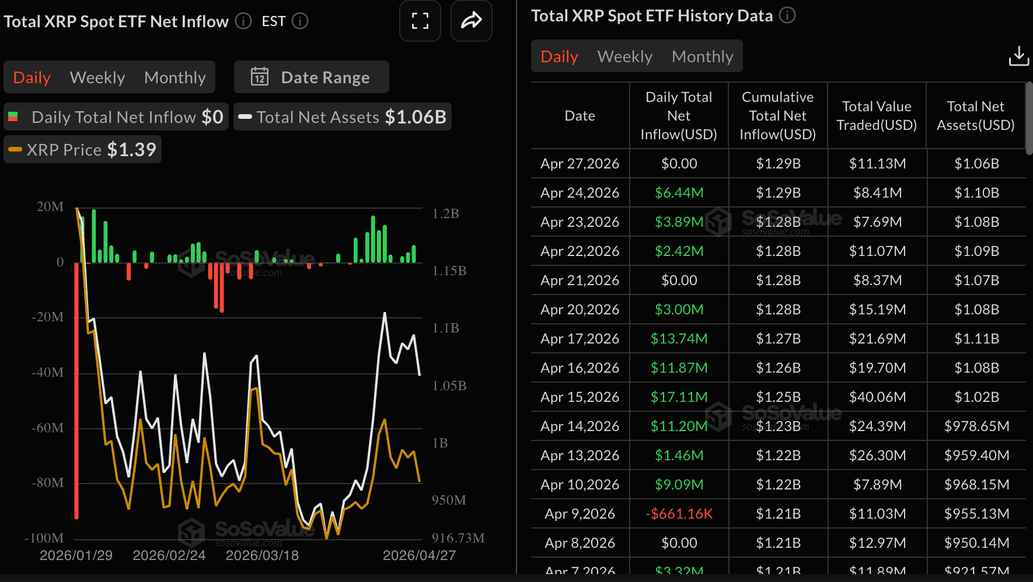
Institutional interest in $XRP digital investment products shows signs of deterioration, as ETFs remained quiet on Monday, with no flows recorded, according to SoSoValue data. Cumulative inflows held at $1.29 billion, while net assets under management averaged $1.06 billion. If sentiment softens further amid deteriorating risk appetite, recovery for $XRP could be an uphill battle.
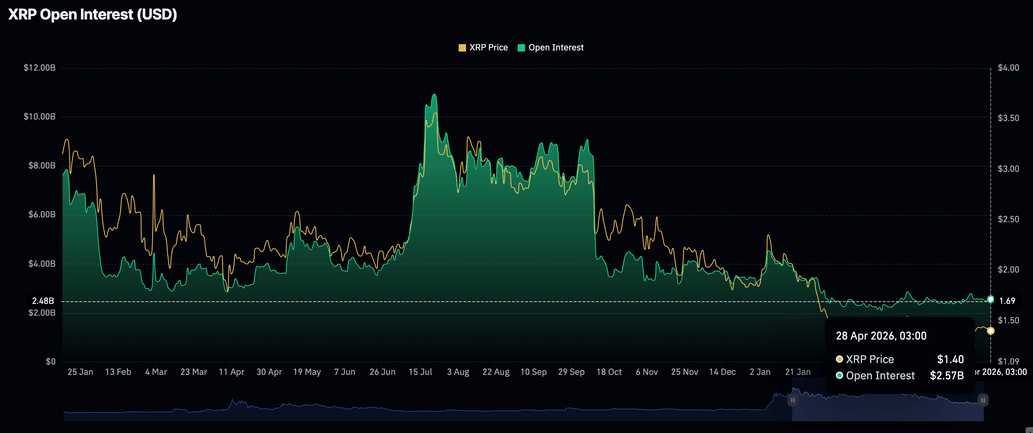
Despite retail demand holding steady with the futures Open Interest (OI) at $2.57 billion, it pales in comparison to the record $10.94 billion reached in July. Low retail demand signals that investors lack conviction in $XRP’s ability to sustain the uptrend. Hence, there is an unwillingness to open new positions.
Technical outlook: $XRP at risk of extending losses
$XRP trades at $1.38, maintaining a bearish near-term bias. The price holds below the 20-day Simple Moving Average (SMA) of the Bollinger Bands around $1.40 and the 50-day Exponential Moving Average near $1.41, confirming a broader bearish outlook.
The Relative Strength Index (RSI) sits just below the 50 midline, around 47 on the daily chart, while the Moving Average Convergence Divergence (MACD) histogram has slipped marginally back below zero, with the signal line turning down. Both indicators suggest waning upside momentum as rallies meet overhead supply.
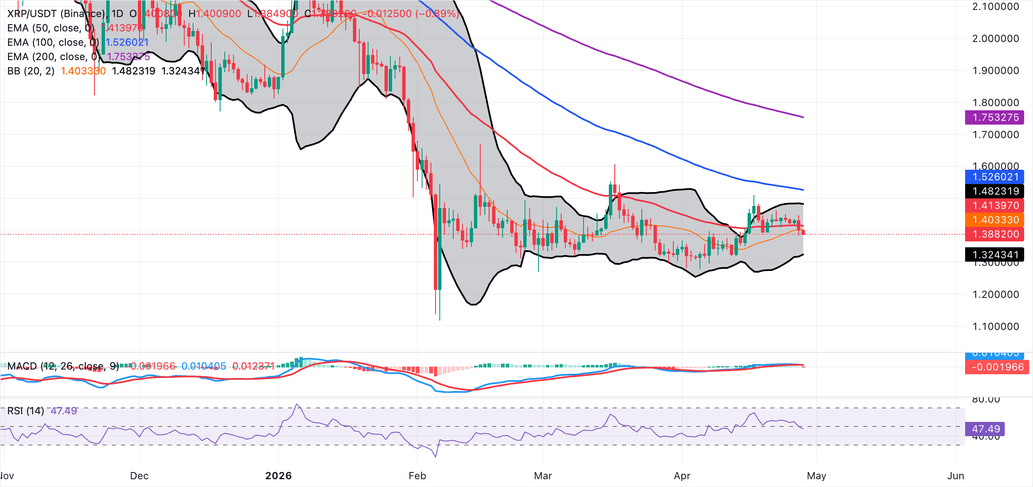
On the topside, initial resistance is aligned at the Bollinger Bands' middle boundary at $1.40, followed by the 50-day EMA around $1.41. A stronger recovery would face further caps at the upper Bollinger Band near $1.48, then at the 100-day EMA at $1.53, and the 200-day EMA near $1.75, reasserting the broader bearish structure. On the downside, the lower Bollinger Band at roughly $1.32 serves as the next notable support, with a sustained break below it likely opening the door to deeper losses within the prevailing daily downtrend.
(The technical analysis of this story was written with the help of an AI tool.)