Solana is trading inside a tightening range as short term charts show pressure building near key resistance. $SOL needs a clean move above the $87 to $88 area to confirm upside momentum, while a drop below $83 could shift focus back to lower support.
Solana Triangle Setup Points to Possible 10% Move as Price Nears Apex
Solana is moving inside a tightening triangle on the 1 hour chart, with price compressed between lower highs and higher lows.
The chart shared by Ali Charts shows $SOL trading near $85.82 after a pullback from the upper trendline. The pattern has narrowed through late April, which means volatility has been shrinking as price moves closer to the triangle apex.
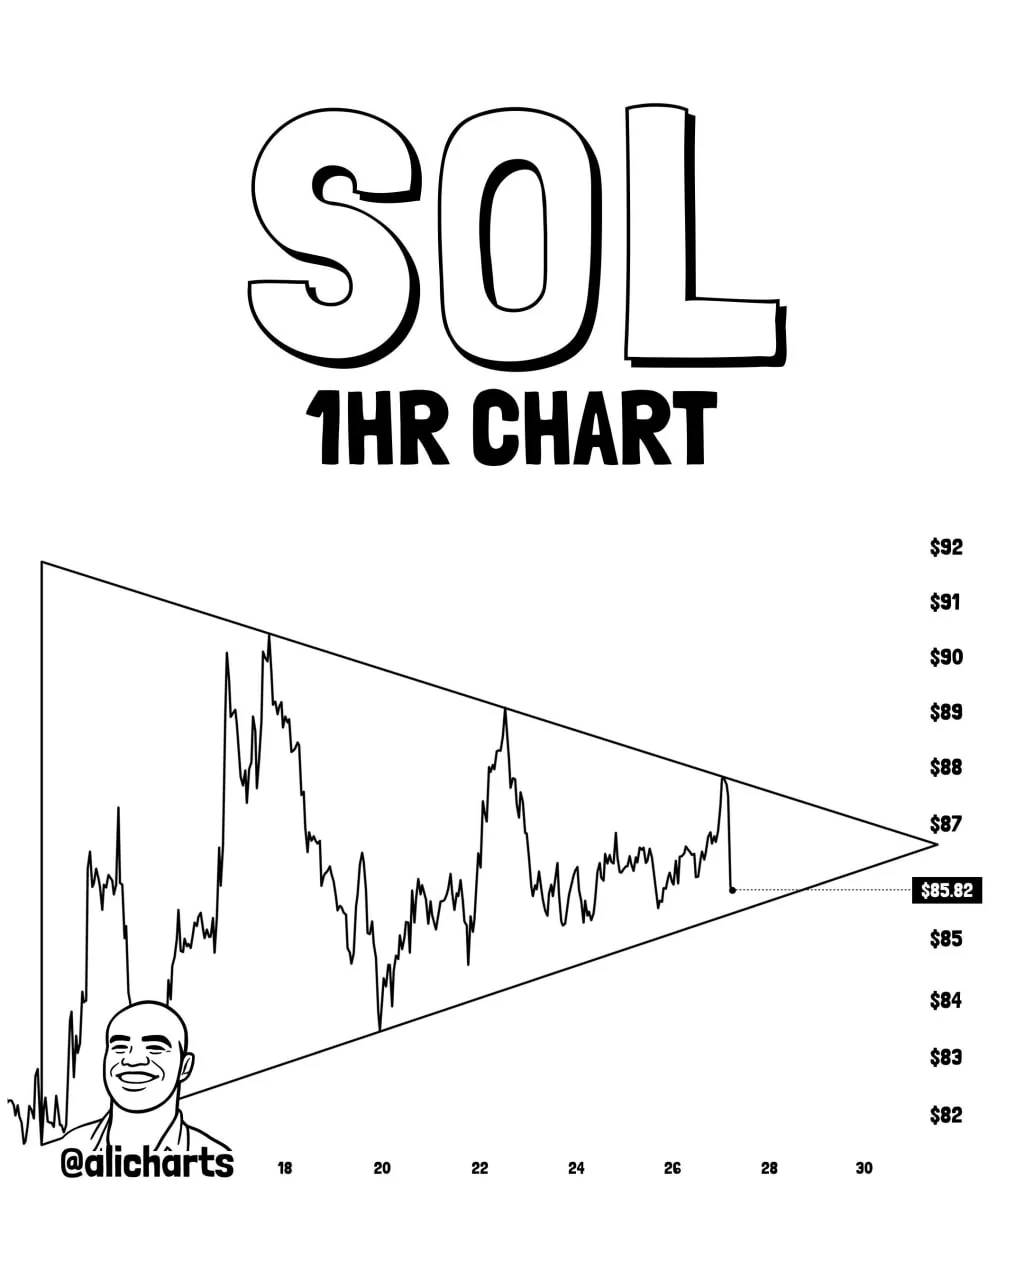
$SOL 1HR Chart. Source: Ali Charts on X
A breakout above the upper trendline near the $87 area would support the bullish case. In that setup, $SOL could target the $89 to $92 range, based on the chart’s visible resistance zone and Ali’s 10% move estimate.
However, a drop below the lower trendline would weaken the setup. That could put the $85 and $84 areas back in focus, with deeper support near $82 if sellers take control.
For now, the chart shows compression rather than a confirmed direction. $SOL needs a clean breakout from the triangle before the next short term move becomes clearer.
Solana Stalls Below Resistance as Consolidation Tightens
Solana is trading in a narrow range below resistance after a strong mid April push, with momentum slowing on the 4 hour Binance chart.
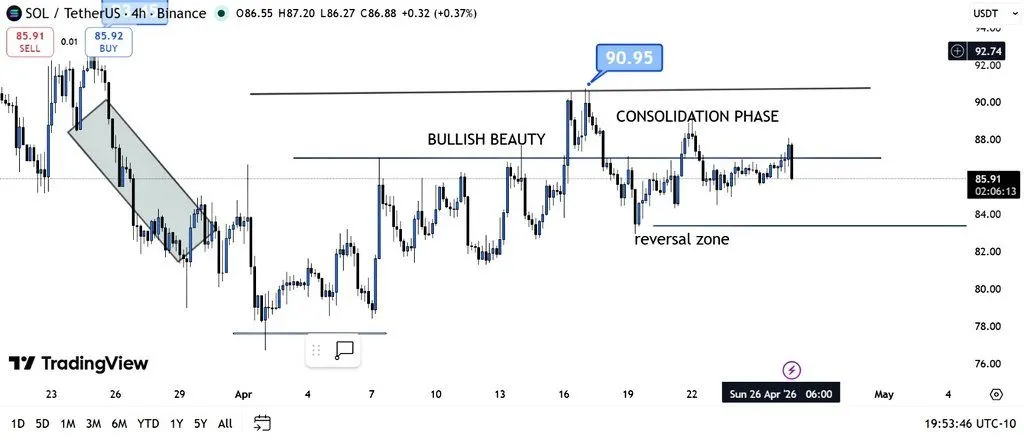
SOLUSDT 4h Binance: Source: BitGuru on X
The chart shared by BitGuru shows $SOL recovering from the early April low near $78 before climbing toward the $90.95 area. That move marked the local high, but price has since failed to extend the breakout.
$SOL is now consolidating between the lower reversal zone near $83 and the resistance area near $87 to $88. The chart shows several attempts to move higher, but buyers have not pushed price back above the previous high.
This range now matters for the next short term move. A clean break above $88 could bring the $90.95 high back into focus. However, failure to reclaim resistance may increase pressure on the lower part of the range.
If $SOL drops below the reversal zone, the setup could shift toward a deeper pullback. In that case, the $82 to $80 area would become the next support zone.
For now, the chart shows consolidation, not a confirmed breakdown. Solana needs a stronger move above resistance to regain momentum and avoid another drop from this range.