$XRP could be eyeing a breakout from a multi-month falling channel pattern, with the mid-term breakout target sitting above $4.
While $XRP has staged a short-term relief bounce, up more than 3.55% in the last 24 hours, it remains within the downtrend that has endured since July 2025. However, data shows this downturn has resulted in a multi-month falling channel, and a breakout could lead to new all-time highs.
Key Points
- The ongoing downtrend puts $XRP within a multi-month falling channel.
- $XRP has collapsed 63% within this pattern since July 2025 despite the recent relief bounce.
- Attempts to breach the channel in October 2025, January 2026, and March 2026 proved futile.
- $XRP witnessed a similar channel in 2025, before a breakout led to the $3.6 all-time high in July.
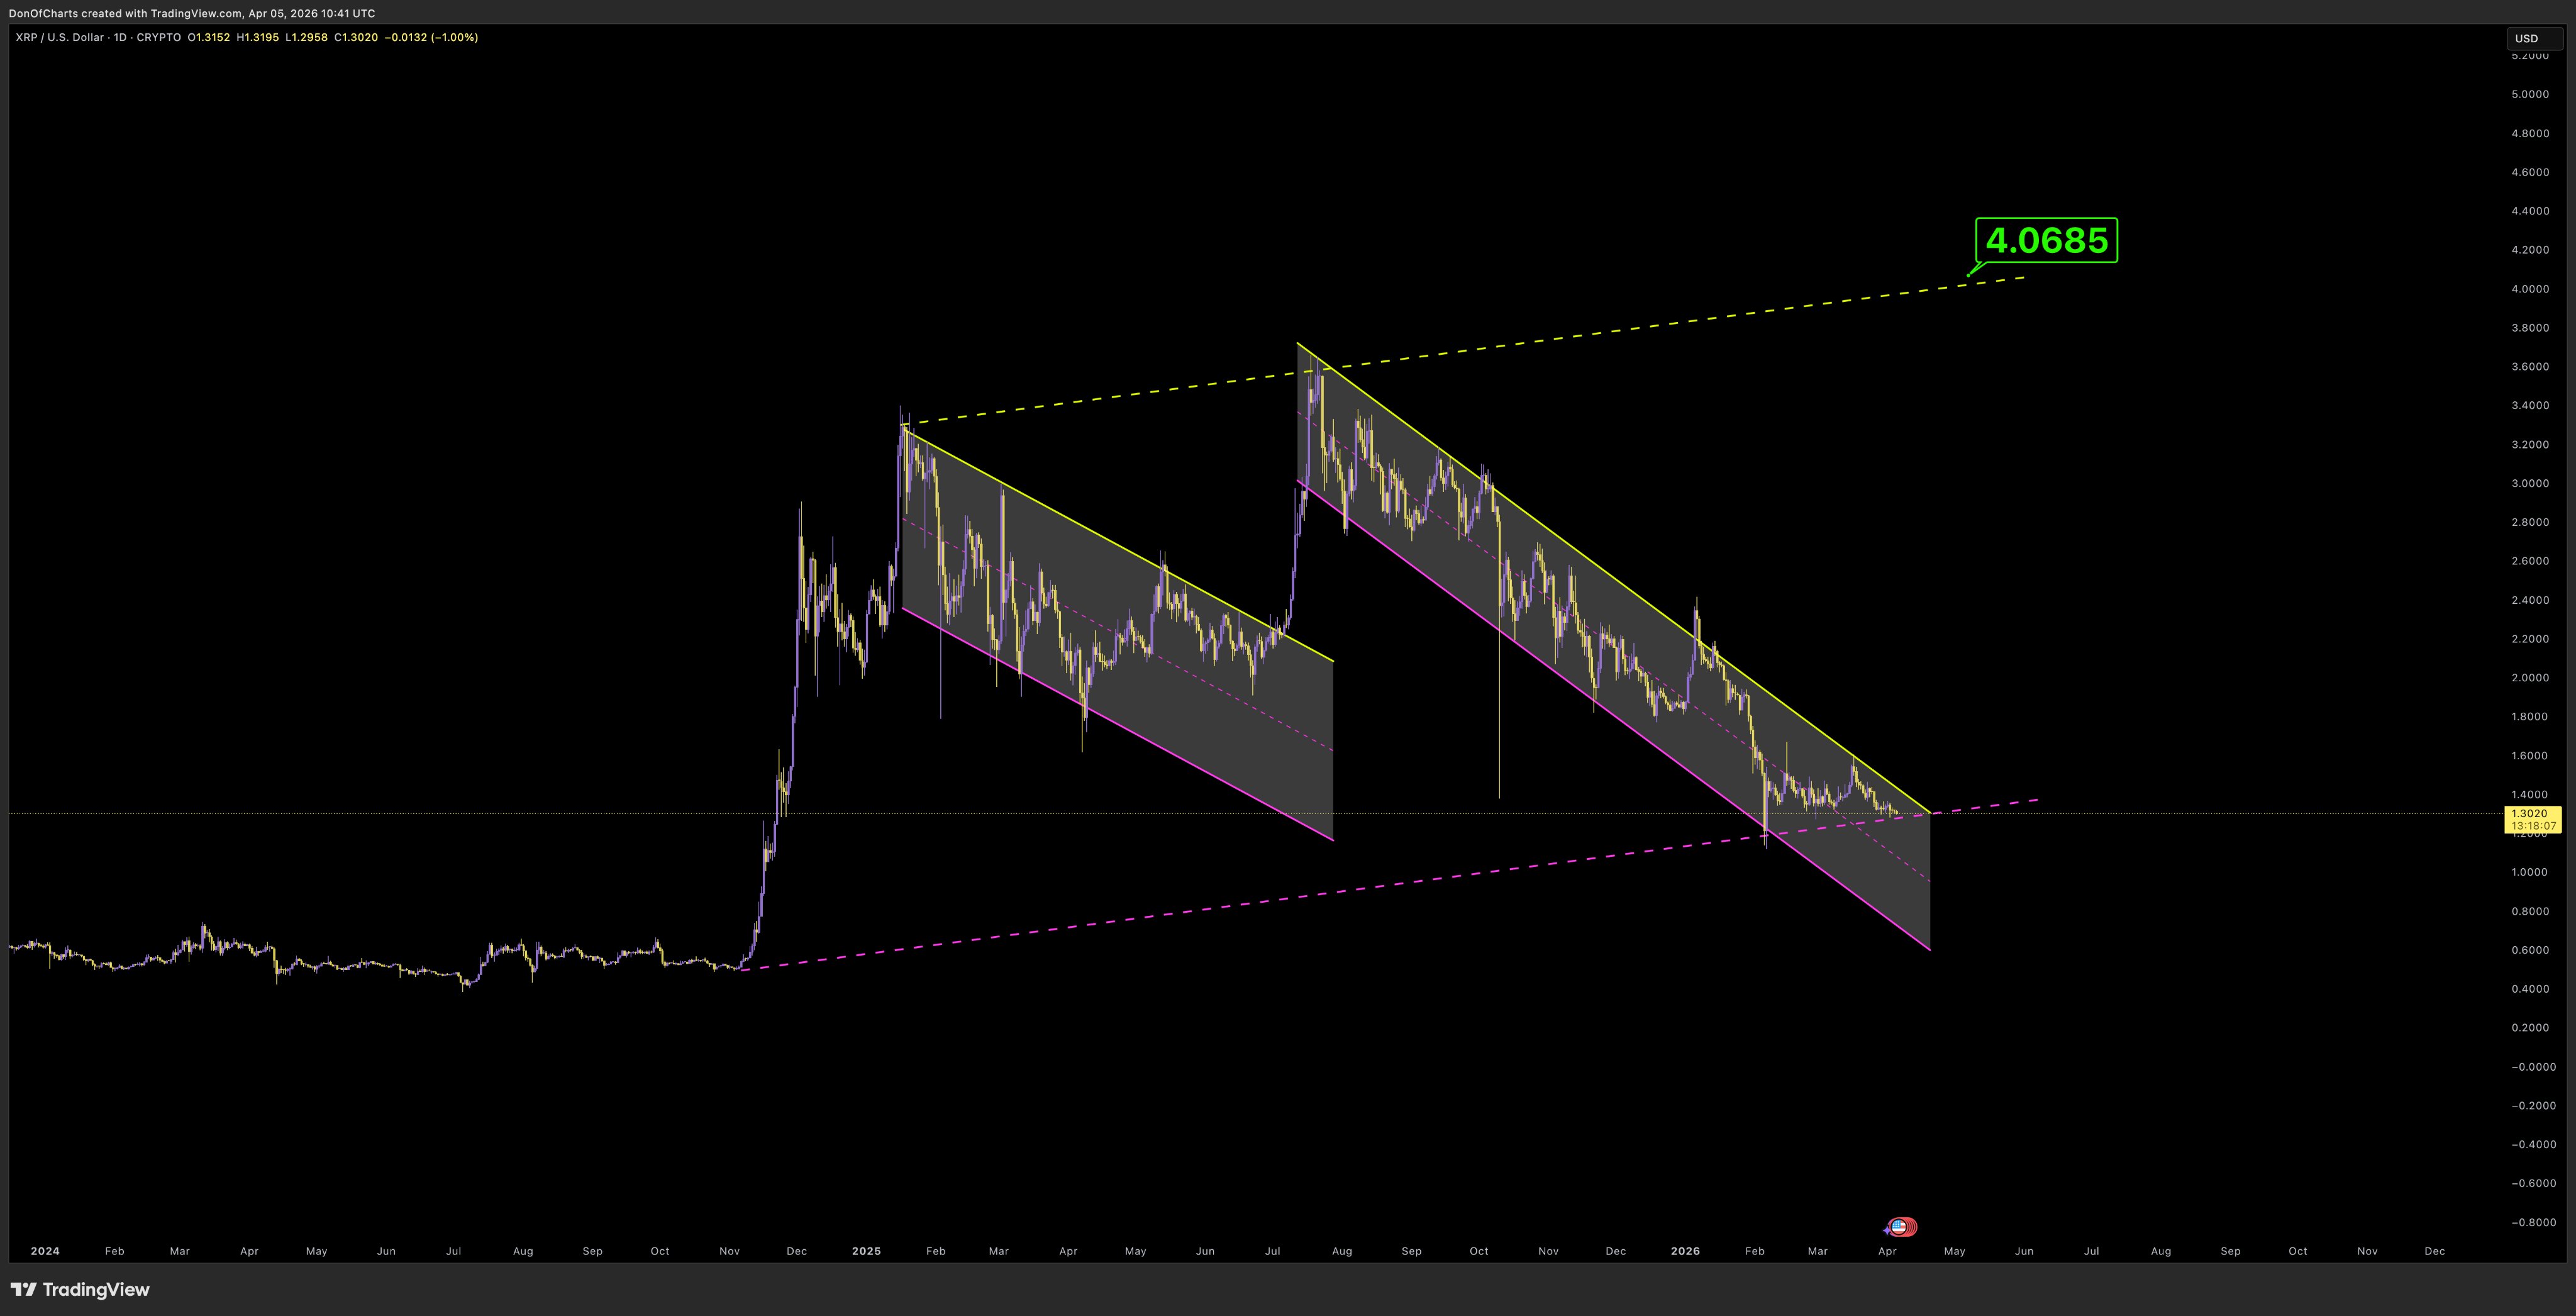
- Chart data shows a breakout above the current channel could push prices above $4.
$XRP Down Despite Relief Bounce
Market commentator Don called the public’s attention to this structure in one of his latest analyses, as $XRP attempts a relief bounce from recent lows. For context, after dropping to a floor price of around $1.27 over the weekend, $XRP staged a recovery effort.
From the $1.27 low, $XRP has rebounded 5.51%, breaking a streak of intraday losses yesterday and maintaining the upward push to today. As a result, the crypto asset has gained 3.55% in the past 24 hours, trading for $1.34 and looking to comfortably sit above the $1.35 area.
Despite the progress made, chart data shows $XRP remains in a massive downtrend when zoomed out. Notably, this downward trend began after the collapse from $3.6 in July 2025, with $XRP down 63% from that peak and recording lower highs and lower lows.
$XRP’s Falling Channel
This sequence of lower highs and lower lows has now resulted in the formation of a falling channel on the daily chart, as highlighted by Don’s analysis. “Where is the $XRP army?” The market commentator asked, as data from his chart shows that $XRP may now be close to a breakout from this channel.
Notably, the channel features an upper descending trendline that has acted as resistance and a lower descending trendline that maintains support. However, due to its nature as a falling channel, the resistance and support levels have continuously lowered amid lower highs and lower lows.
A breakout from this channel would mean an end to the ongoing downtrend and a change in momentum. $XRP has attempted to initiate this breakout multiple times since the downturn began.
First, $XRP aimed to break out when it soared to $3.18 in September 2025, but the price faced resistance at the upper trendline. The same roadblock stood firm when $XRP rose to $3.10 in early October 2025, $2.41 in January 2026, and most recently, $1.6 in March 2026. Each attempt met resistance at the upper trendline.
Historical Data Shows Bullish Potential
Currently, $XRP trades at the upper end of the falling channel, indicating that further price upswings above $1.5 could bring it back to retest the upper trendline. With $XRP now close to the peak of the channel, the chances of a breakout have increased.
Should a breakout ensue from the current position, Don believes $XRP could flip the current momentum to bullish and eye a new all-time high. Specifically, the market analyst projects a possible run to $4.0685, representing a 203% increase from the current price.
Notably, his projection takes a cue from historical data surrounding a previous falling channel. $XRP witnessed this structure after falling from the $3.4 peak in January 2025 and recorded lower highs and lower lows for months until a breakout ensued in July 2025. This breakout pushed prices to the all-time high of $3.6.